The following line graph shows the temperature forecast and the actual temperature for each day of a week.
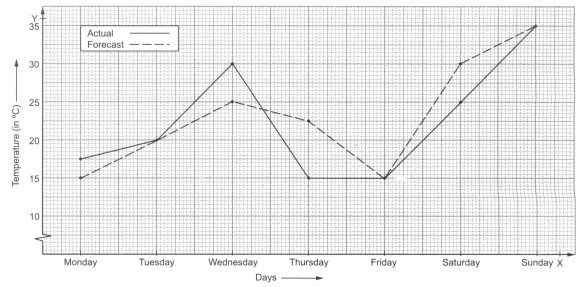
What was the minimum actual temperature during the week?
Important Questions on Line Graphs and Linear Graphs
The following line graph shows the temperature forecast and the actual temperature for each day of a week.
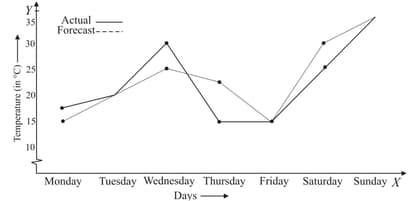
On which day did the actual temperature differ the most from the forecast temperature?
The following distance-time graph is for a car travelling to certain places.

How far does the car travel in hours?
The following distance-time graph is for a car travelling to certain places.

How much time does the car take to reach ?
The following distance-time graph is for a car travelling to certain places.

How long does the car take to cover ?
The following distance-time graph is for a car travelling to certain places.
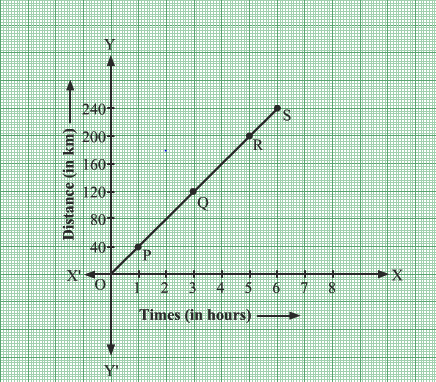
How far is from the starting point?
The following distance-time graph is for a car travelling to certain places.

When does the car reach the place after starting?
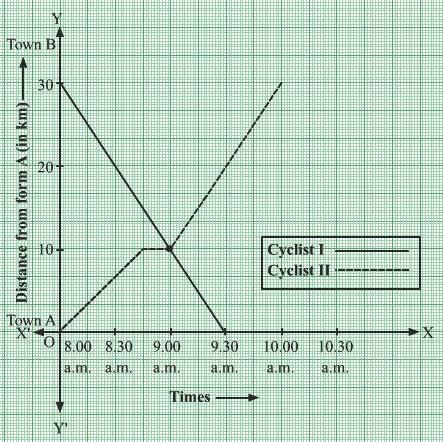
The following line graph shows the journey made by two cyclists, cyclist and cyclist , one from town to town and the other from town to town .
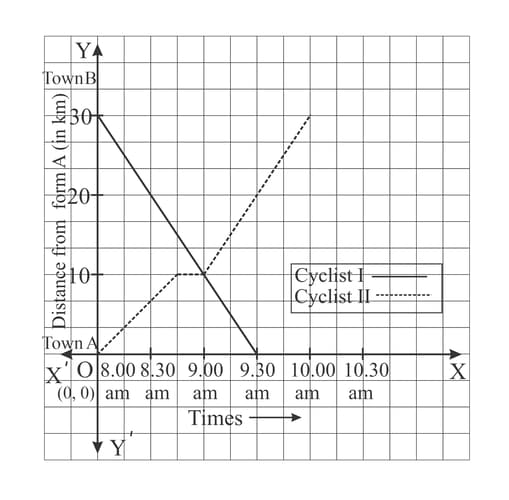
At what time did cyclist rest? For how long did the cyclist rest?
The following line graph shows the journey made by two cyclists, cyclist and cyclist , one from town to town and the other from town to town .