
The following pictograph shows the number of absentees in a class of students during the previous week:
Days
Number of absentees 
Monday
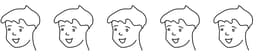
Tuesday
Wednesday

Thursday
Friday

Saturday
(a) On which day were the maximum number of students absent?
(b) Which day had full attendance?
(c) What was the total number of absentees in that week?
Important Questions on Solved Examples
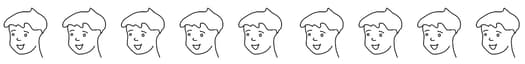
The colours of fridges preferred by people living in a locality are shown by the following pictograph
| Colours | Number of people  - People - People |
| Blue |   |
| Green | |
| Red |  |
| White | |
(a) Find the number of people preferring blue colour.
(b) How many people liked red colour?
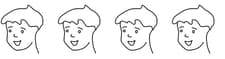
A survey was carried out on students of class VI in a school.
Data about the different modes of transport used by them to travel to school was displayed as pictograph.
What can you conclude from the pictograph.
| Modes of travelling | Number of students  - Student - Student |
| Private car | |
| Public bus | |
| School bus | |
| Cycle | |
| Walking | |
Following is the pictograph of the number of wrist watches manufactured by a factory in a particular week.
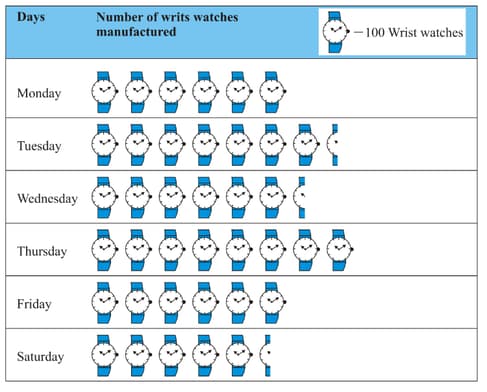
(a) On which day were the least number of wrist watches manufactured?
(b) On which day were the maximum number of wrist watches manufactured?
(c) Find out the approximate number of wrist watches manufactured in the particular week?
The following are the details of number of students present in a class of during a week. Represent it by a pictograph.
| Days | Number of students present |
| Monday | |
| Tuesday | |
| Wednesday | |
| Thursday | |
| Friday | |
| Saturday |
The following are the number of electric bulbs purchased for a lodging house during the first four months of a year.
| Months | Number of bulbs |
| January | |
| February | |
| March | |
| April |
Represent the details by a pictograph.
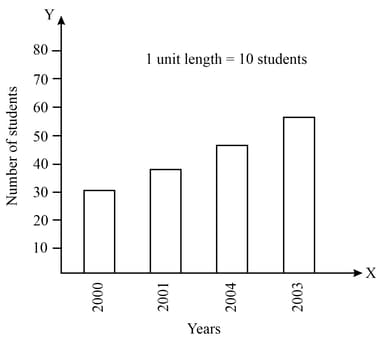
Read the adjoining bar graph showing the number of students in a particular class of a school.
Answer the following questions :
(a) What is the scale of this graph?
(b) How many new students are added every year?
(c) Is the number of students in the year twice that in the year ?
Following table shows the monthly expenditure of Imams' family on various items.
| Items | Expenditure (in) |
|
House rent Food Education Electricity Transport Miscellaneous |
|
To represent this data in the form of a bar diagram, here are the steps.
(a) Draw two perpendicular lines, one vertical and one horizontal.
(b) Along the horizontal line, mark the ‘items’ and along the vertical line, mark
the corresponding expenditure.
(c) Take bars of same width keeping uniform gap between them.
(d) Choose suitable scale along the vertical line. Let unit length and
then mark the corresponding values.
Shabana wants to put a lace border all around a rectangular table cover long and wide.
Find the length of the lace required by Shabana.


