
The following pie-chart shows the percentage distribution of the world population. Study the pie-chart and the answer the question based on it.
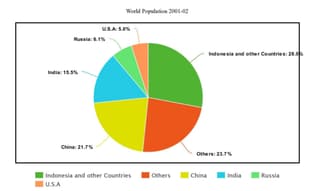
The four major countries constituting half of the world population are arranged in the following descending order,
A. India, China, Russia and U.S.A.
B. China, India, Russia and U.S.A.
C. Russia, U.S.A, China and India.
D. U.S.A, Russia, India and China.
E. Russia, China, India and US.A.
The four major countries constituting half of the world population are arranged in the following descending order,
A. India, China, Russia and U.S.A.
B. China, India, Russia and U.S.A.
C. Russia, U.S.A, China and India.
D. U.S.A, Russia, India and China.
E. Russia, China, India and US.A.
Important Questions on Logical Interpretation of Data
The following pie-chart shows the percentage distribution of the world population. Study the pie-chart and the answer the question based on it.
In terms of percentage, India’s population is larger than that of Russia and the USA by

The following pie-chart shows the percentage distribution of the world population. Study the pie-chart and answer the question based on it.
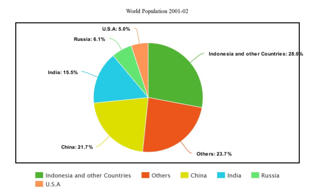
The population of the world in excluding India as estimated by the United Nations was million. Which of the statements is wrong?
A. The percentage of figures include India’s population in .
B. India’s population in was million.
C. The total world population in was million.
D. The percentage of each country is calculated using a denominator of million.
E. Nothing could be ascertained definitely.
The following pie-chart shows the percentage distribution of the world population. Study the pie-chart and answer the question based on it.

Of the countries which constitute of the world population which of the following five countries are given in descending order of their population size?
A. Indonesia, Brazil, Japan, Bangladesh and Pakistan
B. Nigeria, Mexico, Federal Republic of Germany, Italy and the UK.
C. France, Vietnam, Philippines, Indonesia and Brazil
D. Bangladesh, Pakistan, Brazil, Indonesia and Japan
E. It can not be ascertained on the basis of the given data.
Direction: This question is based on the table and diagram of population growth.
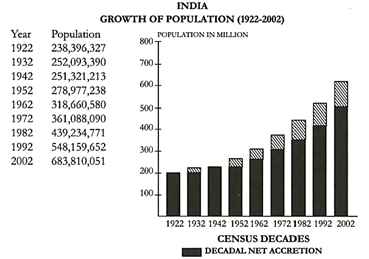
The decadal growth rate between and is:
This question is based on the table and diagram of population growth.
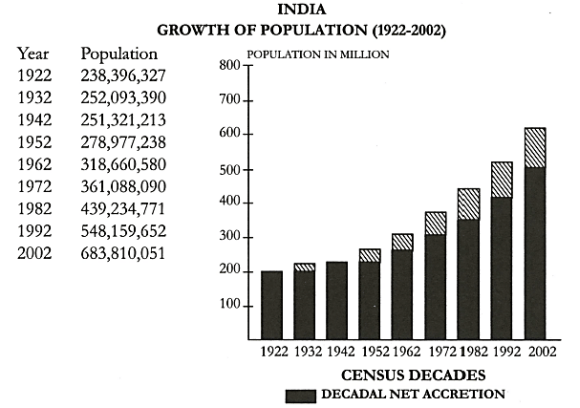
The decadal growth rate between and is:
This question is based on the table and diagram of population growth.
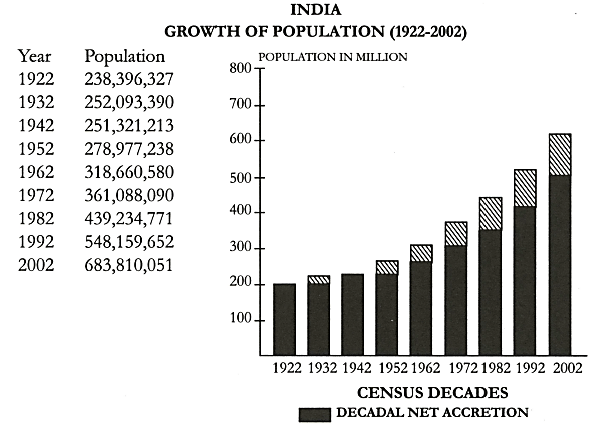
In the population declined by . Which of the following statements is not correct?
(A) The decadal growth rate declined by .
(B) The progressive growth over declined by .
(C) The decadal growth rate was .
(D) The progressive growth rate over was .
(E) The progressive growth rate over was .
Questions are based on the graphs given below in which trends in decadal growth of population of India and some selected states are shown from 1901 to 1981. The states can be grouped on the basis of the decadal growth rates in relation to all-India average for each of the decades from 1992-11 to 1992-2002.
Now among the choices given below each of the questions you have to choose one which suitably belongs or does not belong to the group mentioned in the question.
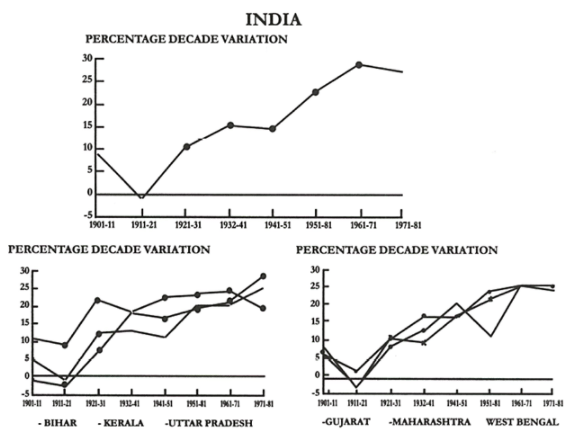
Pick out the state in which growth rate during each of the decades in 1922 to 2002 is always above all-India growth rate
DIRECTIONS : Questions are based on the graphs given below in which trends in decadal growth of population of India and some selected states are shown from 1901 to 1981. The states can be grouped on the basis of the decadal growth rates in relation to all-India average for each of the decades from 1992-11 to 1992-2002.
Now among the choices given below each of the questions you have to choose one which suitably belongs or does not belong to the group mentioned in the question.
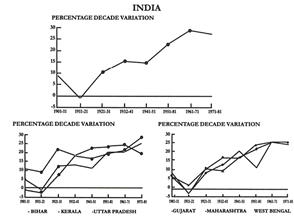
Which of the following states does not belong to the following groups: “Growth rate below the all-India growth rate except in decade mentioned in brackets”?
(A) Maharashtra (1931-41)
(B) West Bengal (1941-51)
(C) Odisha (1961-71)
(D) Bihar (1941-51)
(E) Uttar Pradesh (1971-81)


