
The following pie-chart shows the pets kept by the people of a locality.
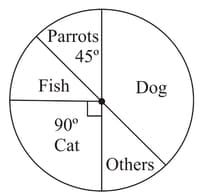
There are people in the locality. Find the number of people who keep a cat.
Important Questions on Data Handling
The following pie-chart shows the pets kept by the people of a locality.
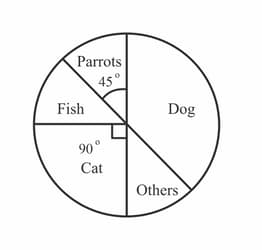
On the basis of the above pie-chart, if the percentage of people who keep a parrot is , then find the value of (in decimal form).
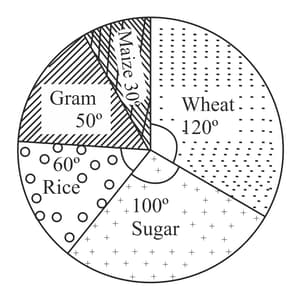
The following pie-chart shows the annual agricultural production of an Indian state. The total production of all the commodities is tonnes. If the production of wheat is tonnes, find the value of .
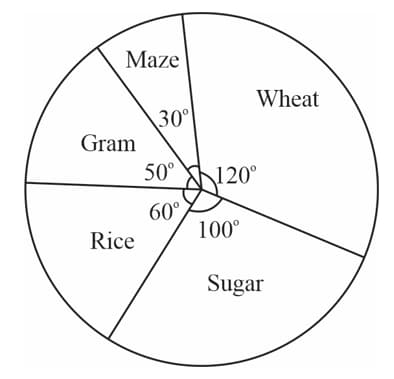
The following pie-chart shows the annual agricultural production of an Indian state. If the total production of all the commodities is tonnes, if the production of sugar is tonnes , then find the value of
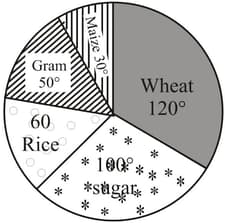
The following pie-chart shows the annual agricultural production of an Indian state. The total production of all the commodities is tonnes. If the production of maize is tonnes, find the value of .
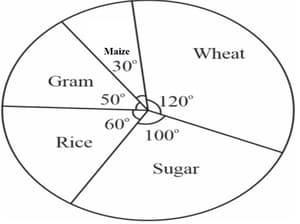
The following pie-chart shows the annual agricultural of an Indian state. If the total production of all the commodities is tonnes, find the production (in tonnes) of gram.
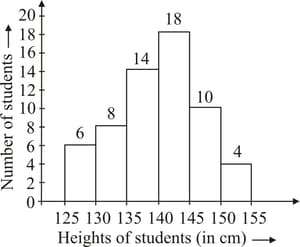
Look at the following histogram and answer the following question.
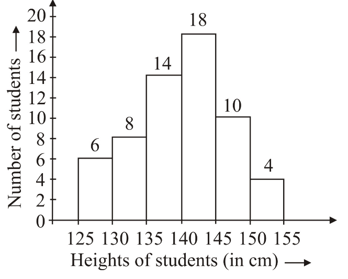
How many students have height more than or equal to but less than ?
Look at the following histogram and answer the following question.
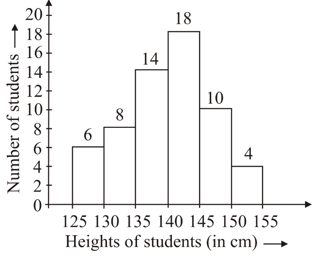
Which class interval has the least number of students?
Look at the following histogram and answer the following question.
What is the class size?


