
The following table gives the percentage distribution of population of five states, P, Q, R, S and T on the basis of poverty line and also on the basis of sex. Study the table and answer the questions based on it.
State
Percentage of Population below Poverty Line
Proportion of Males and Females
Below Poverty Line
Above Poverty Line
M : F
M : F
P
35
5:6
6:7
Q
25
3:5
4:5
R
24
1:2
2:3
S
19
3:2
4:3
T
15
5:3
3:2
If the male population above poverty line for State R is 1.9 million, then the total population of State R is :
Important Questions on Organisation of Data
The given table represents the number of computers sold by four dealers A, B, C and D during the first six months of . Study the table carefully and answer the questions that follows:
| DealerMonth | A | B | C | D |
| January | 102 | 92 | 95 | 107 |
| February | 94 | 96 | 104 | 106 |
| March | 85 | 94 | 100 | 90 |
| April | 108 | 97 | 99 | 96 |
| May | 98 | 102 | 100 | 89 |
| June | 95 | 108 | 102 | 91 |
The total number of computers sold by dealer A during February to June is what percentage more than the total number of computers sold by all the dealers in June? (Correct to one decimal place)
|
Years Products |
2012 | 2013 | 2014 | 2015 | 2016 | 2017 |
| A | 98 | 94 | 80 | 95 | 110 | 115 |
| B | 74 | 96 | 92 | 84 | 98 | 86 |
| C | 82 | 98 | 96 | 88 | 93 | 103 |
| D | 74 | 102 | 92 | 93 | 97 | 102 |
What is the ratio of the total revenue of the company in from the sale of all the four products to the total revenue from the sale of product C in to ?
The given table represents the number of computers sold by four dealers A, B, C and D during the first six months of . Study the table carefully and answer the question that follows.
| Dealer/month | A | B | C | D |
| January | ||||
| February | ||||
| March | ||||
| April | ||||
| May | ||||
| June |
The number of months, in which the number of computers sold by the dealer B was less than the average number of computers sold by dealer C over six months was:
The number of students enrolled in different faculties in a school is as follows:
| Science | Arts | Commerce | Vocational | ||||
| Boys | Girls | Boys | Girls | Boys | Girls | Boys | Girls |
The percentage of students studying in Science & Vocational subjects is:
From the following table, how many patients were in the age group ?
| Age(years) | less than | less than | less than | less than | less than | less than | less than |
| No. of patients. |
The given table represents the number of computers sold by four dealers A, B, C and D during the first six months of . Study the table carefully and answer the questions that follows:
| Dealer \ \Month | A | B | C | D |
| January | 102 | 92 | 95 | 107 |
| February | 94 | 96 | 104 | 106 |
| March | 85 | 94 | 100 | 90 |
| April | 108 | 97 | 99 | 96 |
| May | 98 | 102 | 100 | 89 |
| June | 95 | 108 | 102 | 91 |
The total number of computers sold by dealer B in April, May and June is what percentage of the total nuimber of computers sold by all the dealers in Februray and April?
|
Years Products |
2012 | 2013 | 2014 | 2015 | 2016 | 2017 |
| A | 98 | 94 | 80 | 95 | 110 | 115 |
| B | 74 | 96 | 92 | 84 | 98 | 86 |
| C | 82 | 98 | 96 | 88 | 93 | 103 |
| D | 74 | 102 | 92 | 93 | 97 | 102 |
By what percentage is the total revenue of the company from the sale of products A, B and D in and more than the total revenue from the sale of product B in to ?
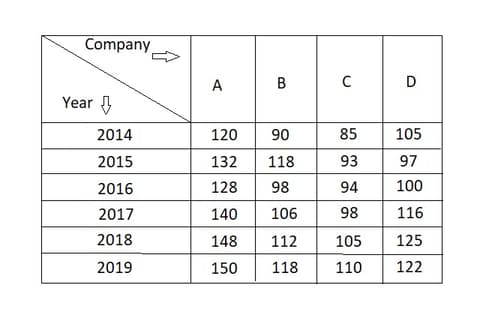
The given table represents the number of engineers recruited by four companies A, B, C and D over the years. Study the table carefully and answer the question that follows:

The number of the years in which the number of engineers recruited by company D is less than average number of engineers recruited by B in the given six years is:
The given table shows the number (in thousands) of cars of five different models A, B, C, D and E produced during years . Study the table and answer the question that follow.
| A | B | C | D | E | TOTAL | |
The percentage decrease in the production of which type of car in , with reference to was the maximum?
The given table shows the number (in thousands) of cars of five different models A, B, C, D and E produced during years . Study the table and answer the question that follows.
| A | B | C | D | E | TOTAL | |
| 2012 | 18 | 26 | 22 | 23 | 31 | 120 |
| 2013 | 22 | 18 | 32 | 40 | 18 | 130 |
| 2014 | 32 | 43 | 26 | 35 | 34 | 170 |
| 2015 | 18 | 22 | 26 | 14 | 20 | 100 |
| 2016 | 36 | 12 | 44 | 38 | 50 | 180 |
| 2017 | 12 | 48 | 40 | 22 | 28 | 150 |
If and are put together, which type of cars constitute exactly of the total number of cars produced in those two years?
The table below shows income (in rupees) for a particular month, together with their sources in respect of employees and .
| Employees | A | B | C | D | E |
| Salary | |||||
| Overtime | |||||
| Arrears | |||||
| Bonus | |||||
| Miscellaneous income | |||||
| Total |
How many employees have their salary more than four times their other incomes?
As per data in the table, what is the percentage of students who got or more marks?
| Scores | ||||||||
| No. of students |
|
Years Products |
2012 | 2013 | 2014 | 2015 | 2016 | 2017 |
| A | 98 | 94 | 80 | 95 | 110 | 115 |
| B | 74 | 96 | 92 | 84 | 98 | 86 |
| C | 82 | 98 | 96 | 88 | 93 | 103 |
| D | 74 | 102 | 92 | 93 | 97 | 102 |
The total revenue of the company from the sale of products B, C and D in is what percentage of the total revenue from the sale of products C and D in years?
The given table represents the number of computers sold by four dealers A, B, C and D during the first six months of . Study the table carefully and answer the question that follows:
| Dealer/Month | A | B | C | D |
| January | 102 | 92 | 95 | 107 |
| February | 94 | 96 | 104 | 106 |
| March | 85 | 94 | 100 | 90 |
| April | 108 | 97 | 99 | 96 |
| May | 98 | 102 | 100 | 89 |
| June | 95 | 108 | 102 | 91 |
What is the ratio of total number of computers sold by dealer A in February, April, May to the total number of computers sold by dealer D in March, May and June?
|
Years Products |
2012 | 2013 | 2014 | 2015 | 2016 | 2017 |
| A | 98 | 94 | 80 | 95 | 110 | 115 |
| B | 74 | 96 | 92 | 84 | 98 | 86 |
| C | 82 | 98 | 96 | 88 | 93 | 103 |
| D | 74 | 102 | 92 | 93 | 97 | 102 |
The number of years in which the revenue of the of company from the sale of product D is more than that the average revenue from the sale of product A over six years is:
The given table represents the production of different types of motorcycles (in thousands) over a period of six years. Study the table carefully and answer the question that follows.
| Years | ||||||
| Motarcycles(type) | ||||||
| A | ||||||
| B | ||||||
| C | ||||||
| D |
What is the percentage increase in the total production of all types of motorcycles from to ?
The given table represents the number of engineers recruited by four companies A, B, C and D over the years. Study the table carefully and answer the question that follows.
The ratio of the total number of engineers recruited by the companies A and B in and to the total number of engineers recruited by C and D in and is:
| A | B | C | D | E | TOTAL | |
| 2012 | 18 | 26 | 22 | 23 | 31 | 120 |
| 2013 | 22 | 18 | 32 | 40 | 18 | 130 |
| 2014 | 32 | 43 | 26 | 35 | 34 | 170 |
| 2015 | 18 | 22 | 26 | 14 | 20 | 100 |
| 2016 | 36 | 12 | 44 | 38 | 50 | 180 |
| 2017 | 12 | 48 | 40 | 22 | 28 | 150 |
In the year , which type of car constitutes exactly of the total numbers of cars produced that year?
The given table shows the number (in thousands) of cars of five different models A, B, C, D and E produced during years . Study the table and answer the question that follow.
| A | B | C | D | E | TOTAL | |
| 2012 | 18 | 26 | 22 | 23 | 31 | 120 |
| 2013 | 22 | 18 | 32 | 40 | 18 | 130 |
| 2014 | 32 | 43 | 26 | 35 | 34 | 170 |
| 2015 | 18 | 22 | 26 | 14 | 20 | 100 |
| 2016 | 36 | 12 | 44 | 38 | 50 | 180 |
| 2017 | 12 | 48 | 40 | 22 | 28 | 150 |
The percentage increase in the total cars in over is:
Following table gives the number of households and their corresponding monthly incomes. What will be the average monthly income of the household?
| SI.no. | No. of Households | Monthly Household income () |


