
The following table represents the percentage of people buying different TV sets. Represent the data in a bar graph.
Brand
purchased
Others
Important Questions on Statistics
The following table represents the percentage of average marks obtained by the students of a school, in their annual examinations. Represent the data in a bar graph.
| Subject | Average Marks obtained by students |
| English | |
| Maths | |
| Science | |
| Social science | |
| Hindi |
The following data collected by Shubham represents the temperature at for week (Collected at 'o clock in the morning)
| Day | Mon | Tue | Wed | Thu | Fri | Sat | Sun |
| Temp |
Represent the above data in a bar graph.
See the data in the following bar diagram. The number of the sale of daily newspapers printed in six languages in a city has been shown. The data are given in thousands. Study the graph and answer the following question.
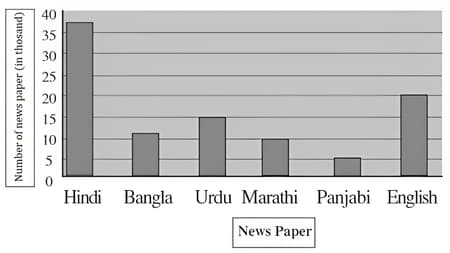
Write the number of Newspapers read in Hindi, Bangla, Urdu, Marathi, Punjabi and English languages.
See the data in the following bar diagram. The no. of the sale of daily newspapers printed in six languages in a city has been shown. The data are given in thousands study the graph and answer the following questions.

How many more Newspapers are read in Marathi rather than Punjabi?
See the data in the following bar diagram. The no. of the sale of daily newspapers printed in six languages in a city has been shown. The data are given in thousands study the graph and answer the following questions.
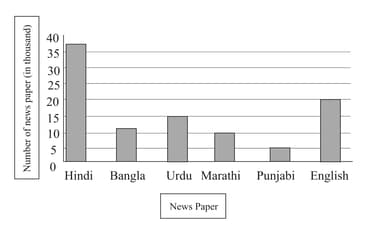
Which language Newspaper has minimum reader?
See the data in the following bar diagram. The no. of the sale of daily newspapers printed in six languages in a city has been shown. The data are given in thousands study the graph and answer the following questions.
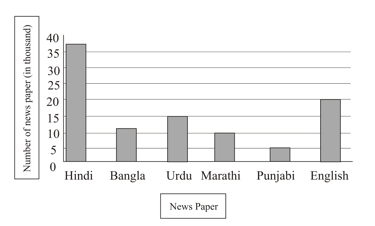
Write in increasing order, the number of Newspaper read in different languages.


