
The following table shows the classification of percentage of marks of students and the number of students. Draw a frequency polygon from the table.
Result
(Percentage)
Number of students
(Percentage)
Important Questions on Statistics
The age group and number of persons, who donated blood in a blood donation camp is given below. Draw a pie diagram from it.
| Age group (years) | ||||
| Number of persons |
The marks obtained by a student in different subjects are shown. Draw a pie diagram showing the information.
| Subject | English | Marathi | Science | Mathematics | Social science | Hindi |
| Marks |
In a tree plantation programme, the number of trees planted by students of different classes is given in the following table. Draw a pie diagram showing the information.
| Standard | th | th | th | th | th | th |
| Number of trees |
The following table shows the percentage of demands for different fruits registered with a fruit vendor. Show the information by a pie diagram.
| Fruits | Mango | Sweet lime | Apples | Cheeku | Oranges |
| Percentages of demand |
The pie diagram in the given figure shows the proportions of different workers in a town.

If the total workers is , then how many of them are working in the field of construction?
The pie diagram in the given figure shows the proportions of different workers in a town.
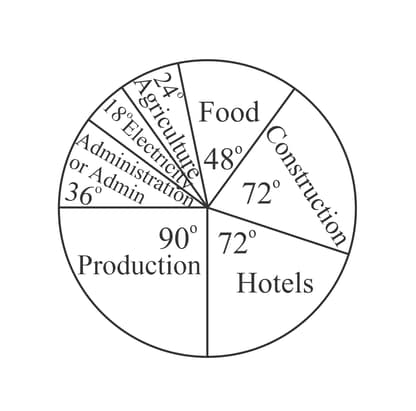
If the total workers is , then how many of them are working in the field of administration/admin?
The pie diagram in the given figure shows the proportions of different workers in a town.
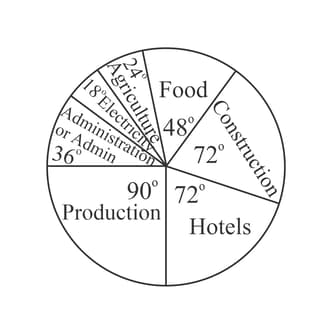
If the total workers is , what is the percentage of workers in the field of production?
The annual investments of a family are shown in the given pie diagram.
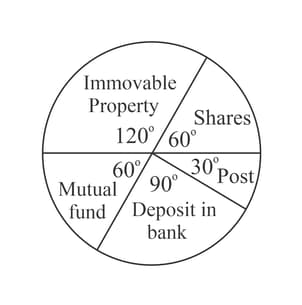
If the investment in shares is , then the total investment is . Find the value of .


