
The following table shows the number of boys and girls in a school playing five different games.
Games
Football
Hockey
Cricket
Tennis
Squash
Number of Boys
Number of Girls
Present this information on a bar graph.
Games
Present this information on a bar graph.
Important Questions on Graphical Representation of Data
The bar graph shows the average swimming speed for some common fish.
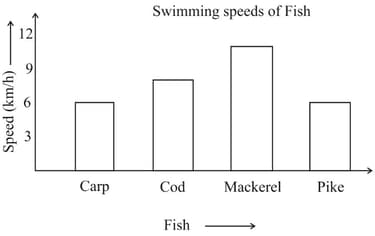
What is the average swimming speed for Carp?
The bar graph shows the average swimming speed for some common fish.
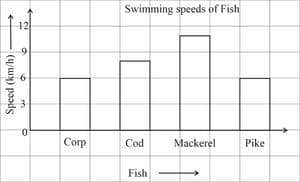
Which fish swims at an average speed of ?
The bar graph shows the average swimming speed for some common fish.
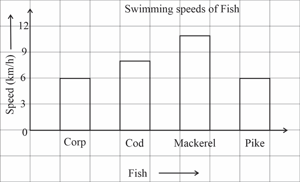
Which fish has the fastest average swimming speed?
The double bar graph given shows the results of a survey on sale of different ice cream flavours. Use it to answer the following questions.
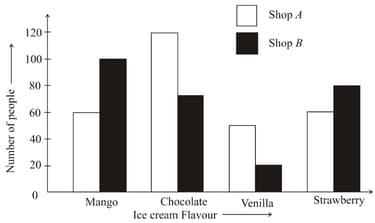
Which flavour of ice cream do people like most in Shop ?
The double bar graph given shows the results of a survey on the sale of different ice cream flavours. Which flavour of ice cream is liked the most in both the shops together?
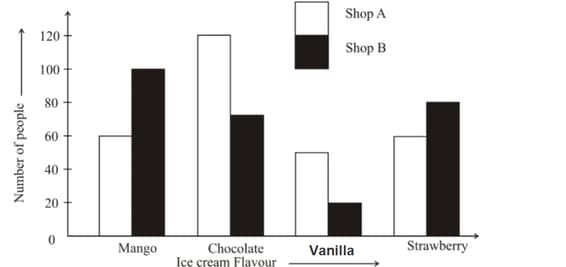
The double bar graph given shows the results of a survey on sale of different ice cream flavours. Use it to answer the following questions.
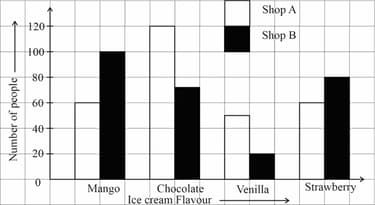
Express the sale of strawberry ice creams in shop as a percent of the total number of ice creams sold.
The double bar graph given shows the results of a survey on sale of different ice cream flavours. Use it to answer the following question.
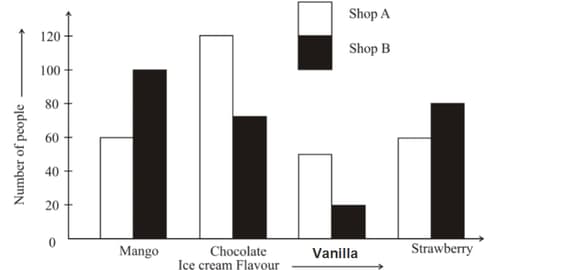
If shop sold 50 vanilla ice creams then find .
The double bar graph given shows the results of a survey on the sale of different ice cream flavours.
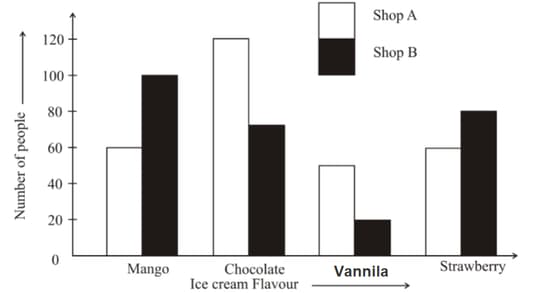
Find the ratio of the number of mango ice creams sold in shop to the number of vanilla ice creams sold in shop .


