
MEDIUM
8th CBSE
IMPORTANT
Earn 100
The following table shows the sides and corresponding perimeters of some squares. Draw the graph for the given data.
Side (in cm)
Perimeter (in cm)
Important Questions on Introduction to Graphs
HARD
8th CBSE
IMPORTANT
HARD
8th CBSE
IMPORTANT
HARD
8th CBSE
IMPORTANT
MEDIUM
8th CBSE
IMPORTANT
Draw a line graph depicting the sales of a salesman during weekdays:
| Days (x) | Monday | Tuesday | Wednesday | Thursday | Friday | Saturday |
| Sales (y) |
MEDIUM
8th CBSE
IMPORTANT
Plot the points on the graph paper and join B to C. Find the area of the figure so obtained.
EASY
8th CBSE
IMPORTANT
The following graph shows the temperature of a solution recorded over a period of time.
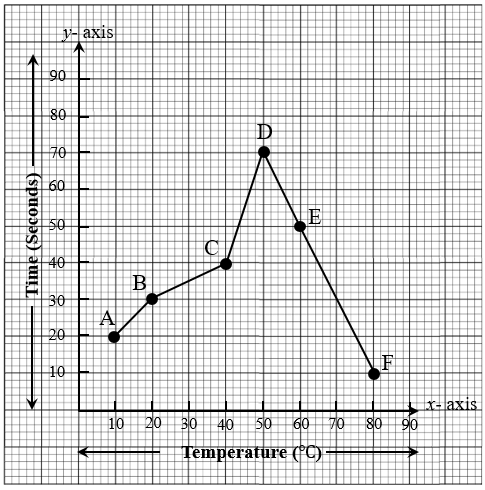
Which point depicts the maximum temperature?
MEDIUM
8th CBSE
IMPORTANT
The following graph shows the temperature of a solution recorded over a period of time.
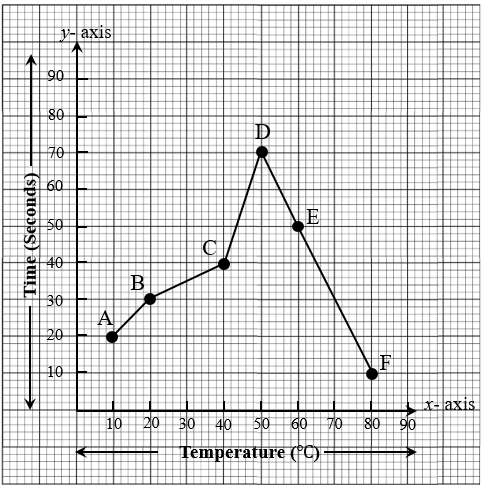
What is the difference in temperatures at the end of and ?
MEDIUM
8th CBSE
IMPORTANT
The following graph shows the number of passengers travelling in a metro during different hours of a day.
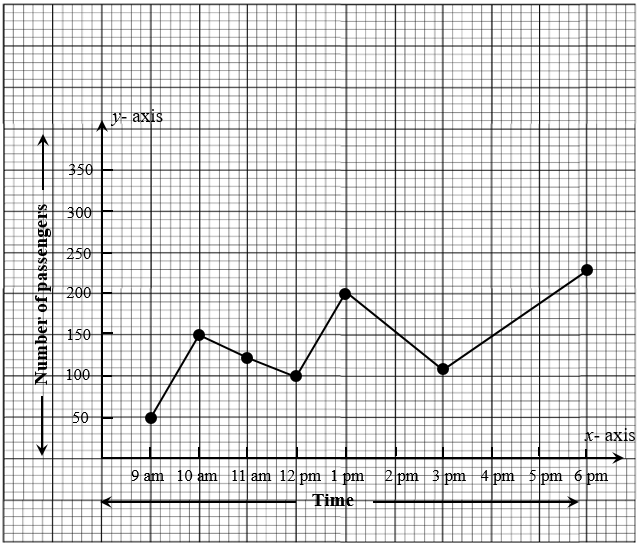
At what time was the crowd the maximum?


