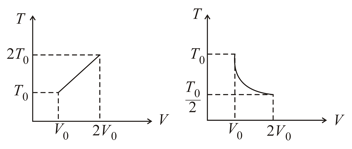
The given curve represents the variation of temperature as a function of volume for one mole of an ideal gas. Which of the following curves best represent the variation of pressure as a function of volume?
Important Questions on Thermodynamics
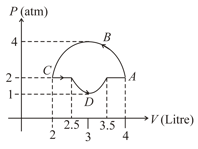
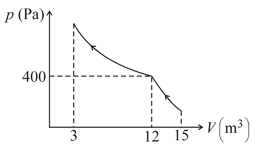
Find work done by the gas in the process shown in figure.
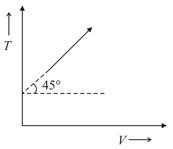
For two thermodynamic process temperature and volume diagram are given. In first process, it is a straight line having initial and final coordinates as and , where as in second process it is a rectangular hyperbola having initial and final coordinates and . Then, the ratio of work done in the two processes must be,
The curve in the figure shows the adiabatic compression of an ideal gas from followed by an isothermal compression to a final volume of . There are of the gas. The total heat supplied to the gas is equal to ,
The figure shows a conducting cylinder containing a gas and closed by a movable piston. The cylinder is submerged in an ice-water mixture. The piston is quickly pushed down from position to position . The piston is held at position until the gas is again at and then is slowly raised back to position .
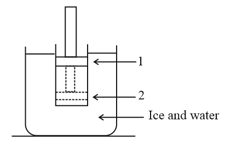
The diagram for the above process is,
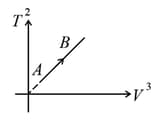
If ideal diatomic gas follows the process as shown in graph where is temperature in and is volume , then molar heat capacity for this process will be [in terms of gas constant ],