
MEDIUM
9th CBSE
IMPORTANT
Earn 100
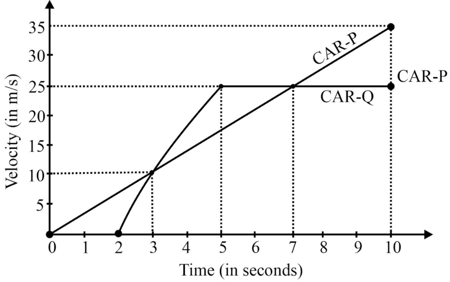
The given diagram shows velocity-time graphs of cars P and Q, starting from the same place and in the same direction.
Calculate the acceleration of car Q between in . (Give the answer in two decimal points)
50% studentsanswered this correctly
Important Questions on Motion
EASY
9th CBSE
IMPORTANT
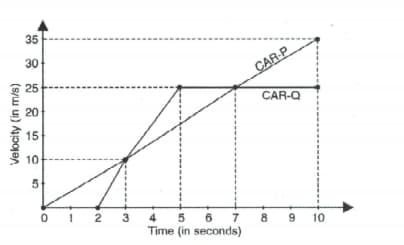
The given diagram shows velocity-time graphs of cars P and Q, starting from the same place and in the same direction.
Calculate at what time both the cars have the same velocity?
MEDIUM
9th CBSE
IMPORTANT
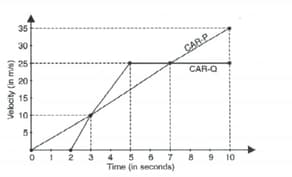
The given diagram shows velocity-time graphs of cars P and Q, starting from the same place and in the same direction.
Calculate which car is ahead after and by how much?
HARD
9th CBSE
IMPORTANT
HARD
9th CBSE
IMPORTANT
EASY
9th CBSE
IMPORTANT
EASY
9th CBSE
IMPORTANT
EASY
9th CBSE
IMPORTANT
EASY
9th CBSE
IMPORTANT


