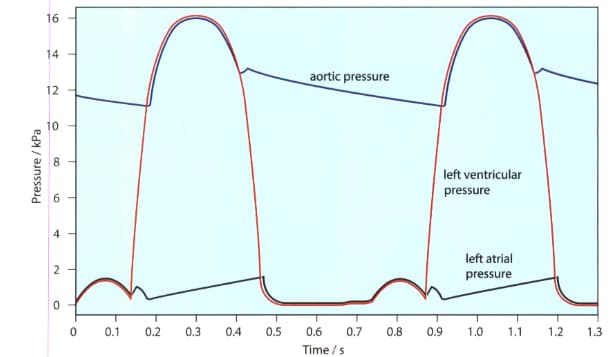
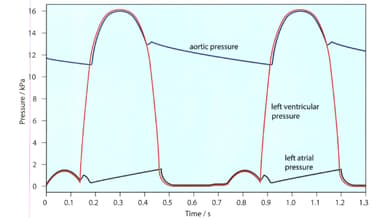
The given figure shows the pressure changes in the left atrium, left ventricle and aorta throughout two cardiac cycles.
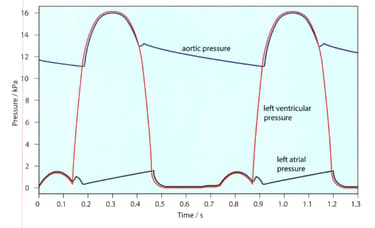
What is the heart rate represented on this graph in beats per minute?
Important Questions on Transport in Mammals
The given figure shows the pressure changes in the left atrium, left ventricle and aorta throughout two cardiac cycles. Make a copy of this diagram.

The contraction of the muscles in the ventricle wall causes the pressure inside the ventricle to rise. When the muscles relax, the pressure drops again.
In your copy of the diagram mark the time when the ventricle is contracting.
The given figure shows the pressure changes in the left atrium, left ventricle and aorta throughout two cardiac cycles. Make a copy of this diagram.
The contraction of the muscles in the ventricle wall causes the pressure inside the ventricle to rise. When the muscles relax, the pressure drops again.
In your copy of the diagram mark the time when the ventricle is relaxing.
The given figure shows the pressure changes in the left atrium, left ventricle and aorta throughout two cardiac cycles. Make a copy of this diagram.

The contraction of muscles in the wall of the atrium raises the pressure inside it. This pressure also raised when the blood flows into the atrium from the veins, while the atrial walls are relaxed.
In your copy of the diagram mark the time when the atrium is contracting. (atrial systole)
The given figure shows the pressure changes in the left atrium, left ventricle and aorta throughout two cardiac cycles. Make a copy of this diagram.

The contraction of muscles in the wall of the atrium raises the pressure inside it. This pressure also raised when the blood flows into the atrium from the veins, while the atrial walls are relaxed.
In your copy of the diagram mark the time when the atrium is relaxing. (atrial diastole)
The given figure shows the pressure changes in the left atrium, left ventricle and aorta throughout two cardiac cycles. Make a copy of this diagram.

The atrioventricular valves open when the pressure of the blood in the atria is greater than that in the ventricles. They snap shut when the pressure of the blood in the ventricles is greater than in the atria.
On your diagram, mark the points at which these valves will open and close.
The given figure shows the pressure changes in the left atrium, left ventricle and aorta throughout two cardiac cycles. Make a copy of this diagram.

The opening and closing of the semilunar valves in the aorta depends on the relative pressures in the aorta and ventricles. On your diagram, mark the points at which these valves will open and close.
The given figure shows the pressure changes in the left atrium, left ventricle and aorta. Make a copy of this diagram.
The right ventricle has much less muscle in its walls than the left ventricle, and only develops about one quarter of the pressure developed on the left side of the heart. On your diagram, draw a line to represent the probable pressure inside the right ventricle over the 1.3 seconds down.
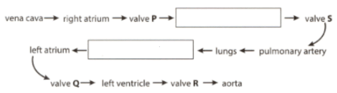
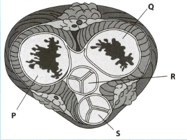
The given diagram shows a cross-section of the heart at the level of valves.
Complete the following chart to show the pathway of the blood through heart.