
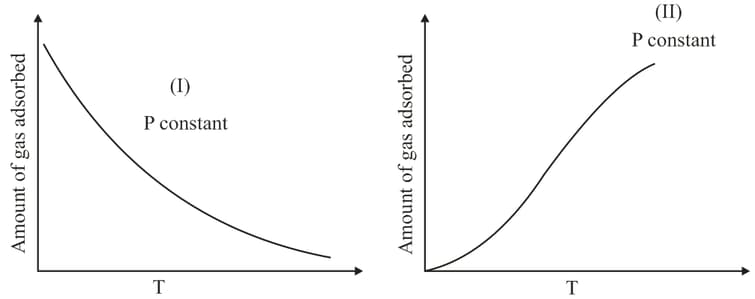
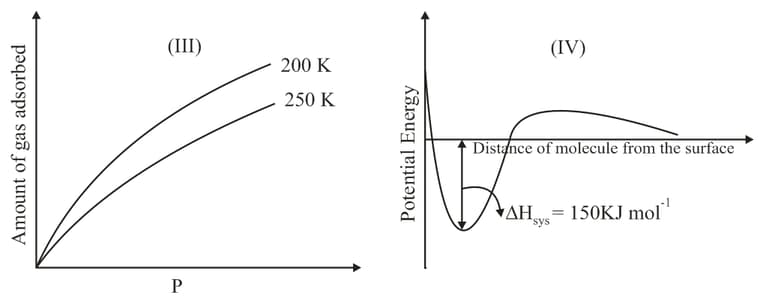
The given graphs / data and represent general trends observed for different physisorption and chemisorption processes under mild conditions of temperature and pressure. Which of the following choice (s) about and is (are) correct?
Important Questions on Surface Chemistry
The curve that best describes the adsorption of a gas on of a solid substrate as a function of pressure at a fixed temperature
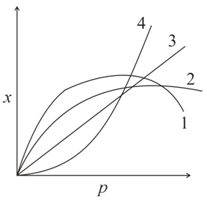 is
is
Freundlich adsorption isotherms for the physical adsorption of a gas at temperature and are shown in the graph given below. The correct relationship between and is
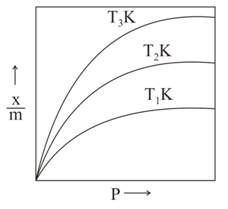
Adsorption of the gas increases with:
The mass of gas adsorbed, , per unit mass of adsorbate, , was measured at various pressures, A graph between and gives a straight line with slope equal to and the intercept equal to . The value of at a pressure of is :
(Given )
Consider the following statements about Langmuir isotherm.
I. The free gas and adsorbed gas are in dynamic equilibrium.
II. All adsorption sites are equivalent.
III. The initially adsorbed layer can act as a substrate for further adsorption.
IV. The ability of a molecule to get adsorbed at a given site is independent of the occupation of neighboring sites.
The correct statements are
( is the mass of the gas adsorbed per gram of adsorbent)
In Freundlich adsorption isotherm, slope of line is:
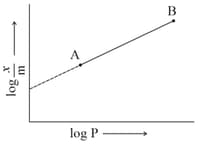
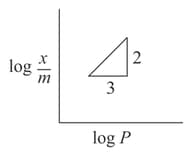
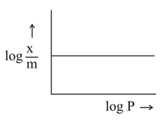
If equation represents the Freundlich adsorption isotherm where is the mass of the gas adsorbed on mass of the adsorbent at pressure . and are constants which depend on the nature of adsorbent and the gas. Which of the following conditions represents the figure?
gas adsorbs on charcoal following Freundlich adsorption isotherm. For a given amount of charcoal, the mass of adsorbed becomes times when the pressure of is doubled.
The value of in the Freundlich isotherm equation is (Round off to the Nearest Integer)


