
EASY
Earn 100
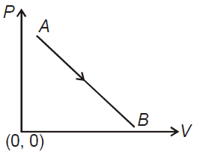
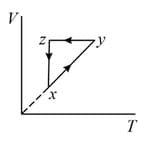
The given indicator diagram shows variation of pressure with volume for a thermodynamical system which is taken from state to state . During the process
50% studentsanswered this correctly
Important Questions on Thermodynamics
EASY
MEDIUM
HARD
The equation of state of moles of a non-ideal gas can be approximated by the equation where, and, are constant characteristics of the gas. Which of the following can represent the equation of a quasi-static adiabatic for this gas (assume that, is the molar heat capacity at constant volume is independent of temperature)?
EASY
MEDIUM
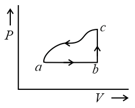
The corresponding P - V diagram for the process is (all figures are schematic and not drawn to scale) :
HARD
EASY
MEDIUM
HARD
EASY
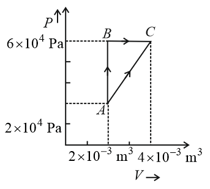
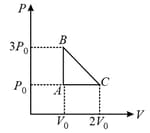
In process AB, of heat is added to the system and in process BC, of heat is added to the system. The heat absorbed by the system in the process AC will be:
HARD
| Column – 1 | Column – 2 | Column – 3 |
| (I) | (i) Isothermal | (P) 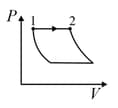 |
| (II) | (ii) Isochoric | (Q) 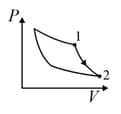 |
| (III) | (iii) Isobaric | (R) 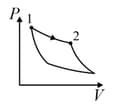 |
| (IV) | (iv) Adiabatic | (S)  |
HARD
EASY
MEDIUM
Two moles of an ideal monoatomic gas occupies a volume at . The gas expands adiabatically to a volume . Calculate the final temperature of the gas and change in its internal energy.
EASY
MEDIUM
HARD
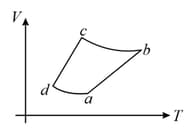
The - diagram that best describes this cycle is: (Diagrams are schematic and not to scale)
HARD
MEDIUM
EASY
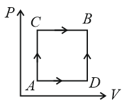
When path is used of heat flows into the system and of work is done by the system. If the path is used then work done by the system is , the heat flows into the system in the path is:


