
The given pictograph shows the sale of houses by a property dealer in different months.
Months
Number of houses sold
January

February
March
April
May
Each represents house.
How many houses did the dealer sold in February and March altogether?
represents house.Important Questions on Data Handling
The given table shows the types of chocolates children like in a society.
| Chocolates | Tally Marks |
| Dairy milk | |
| Kit kat | |
| Perk | |
| Munch |
How many more students like Dairy milk than Munch?
 represents ice creams, then how many ice creams represents?
The given bar graph shows the number of cars washed by five friends to raise money for local children hospital.
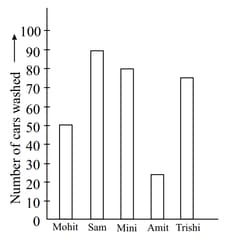
What is the difference the number of car washed (Trishi and Sam) and (Mohit and Mini)?
The given table shows the number of chapatis Ms Sharma made on each day in a week.
| Days | Number of chapatis |
| Monday | |
| Tuesday | |
| Wednesday | |
| Thursday | |
| Friday | |
| Saturday | |
| Sunday |
How many chapatis did she make in the whole week?
The given table shows the number of chapatis Ms Sharma made on each day in a week.
| Days | Number of chapatis |
| Monday | |
| Tuesday | |
| Wednesday | |
| Thursday | |
| Friday | |
| Saturday | |
| Sunday |
The given bar graph shows the sale of story books in a bookshop for the first months.
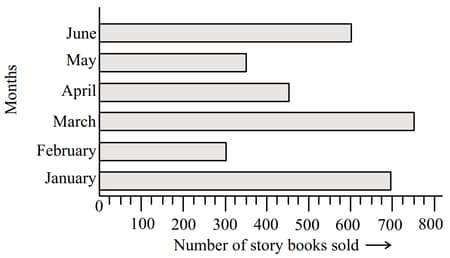
In which month, the sale of story books was of the sale of books in June?


