
The given pie chart shows the percentages of blood types for a group of people.
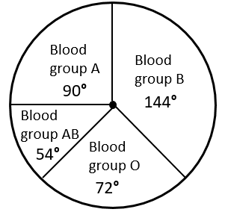
How many people in this group have blood type ?
Important Questions on Data Handling
The following pie chart shows the percentage expenditure of a country on different heads. The total expenditure is (in billions). Study the chart and answer the question.

The expenditure on Education is what percentage less than the expenditure on Defence?
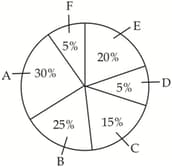
Using the pie-chart answer the following:
If the annual income of the family is , the savings is:
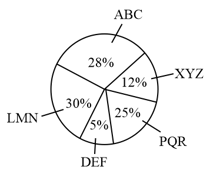
Study the following pie chart carefully and answer the question given below.
The pie chart shows information about $5$ mobile phone manufacturing companies in India. The total units of mobile phones manufactured by these companies together is $12,40,000$.
How many units of mobile phones are manufactured by company ‘DEF’?
The given pie chart shows the percentage distribution of employees in an organisation. Read the pie chart and answer the question that follows.

If of the employees in department D are males, how many female employees are there in that department?
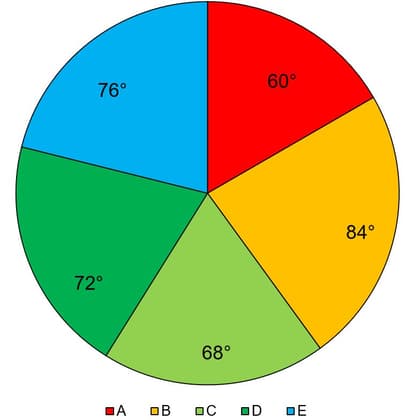
Complete the table.
| Age group (in years) | No. of persons | Measure of central angle. |
| _____ | ||
| _____ | ||
| _____ | ||
| _____ | ||
| Total | _____ |
The following pie chart shows the percentage expenditure of a country on different heads. The total expenditure is (in billions). Study the chart and answer the question.
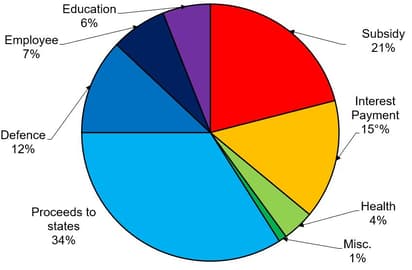
The expenditure for Proceeds to state (in billions ) is _____.
Using the pie-chart answer the following:
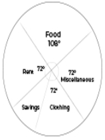
If the annual income of the family is , then the savings are:
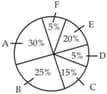
The given pie-chart shows the break-up of total marks obtained by students in five subjects and . The maximum marks in each subjects is and he obtained a total of marks.
What is the difference between the marks obtained by the students in subject and ?
The given pie chart shows information about Non–Peforming Assets (NPA) Processed by the various banks of India till December 2017.
If the total NPAs under all the banks are worth Rs. lakh crores, then NPAs worth how much (in Rs. lakh crores) does Bank ‘D’ contain till December 2017?
The HR department of a company prepared a report. The pie chart from this report shows number of employees in all the departments that the company has. Study the diagram and answer the following questions.
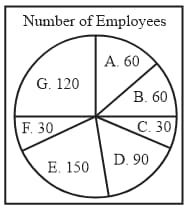
If the average monthly salary of the employees of this company is then, what is the total of the salaries (in lacs) paid to all the employees of this company?
The given pie chart shows the percentage distribution of employees in an organisation. Read the pie chart and answer the question that follows.
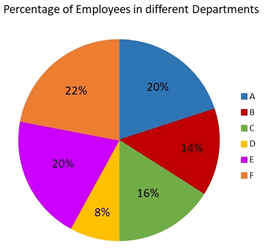
What is the number of employees working in department F?
The following pie-charts show the distribution of students enrolled in higher secondary and in college education, with respect to the household income of their families.
The chart for Higher Secondary Education:
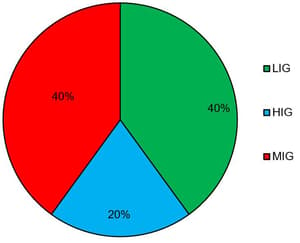
The chart for College Education:

The ratio between the number of students from LIG household category studying at higher secondary to those in college is:
The given pie-chart shows the favourite sport of the students of a school.
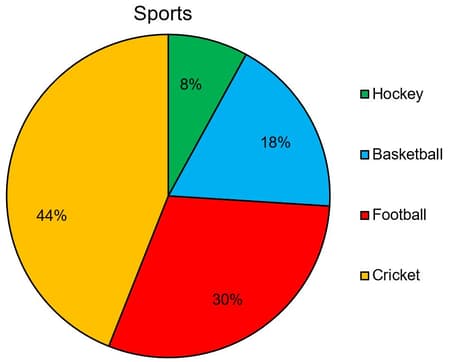
In the given pie-chart, if there were students in all, how many liked football?
The following pie chart shows the percentage expenditure of a country on different heads. The total expenditure is (in ). Study the chart and answer the question.
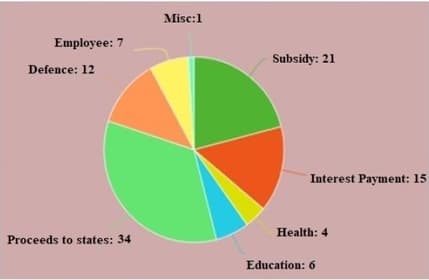
The central angle of the sector representing expenditure on Interest payment is:
The given pie-chart shows favourite sport of students of a school.
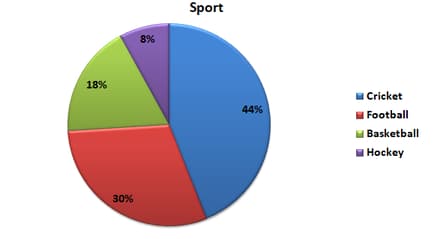
In the given pie-chart, what is the difference in percentage between liking for football and basketball?
The given pie-chart, shows the percentage distribution of the expenditure incurred in publishing a book. Study the pie-chart and answer the questions based on it.
Various Expenditures (in percentage) Incurred in Publishing a Book
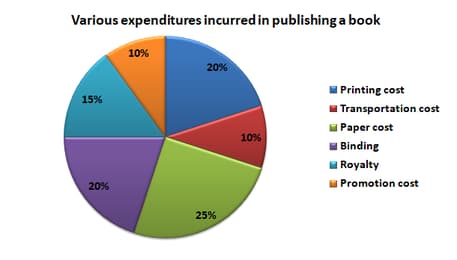
In the given pie-chart, by what percentage Printing and Binding cost on the book is less than the other costs?
The given pie-chart shows favourite sport of students of a school.
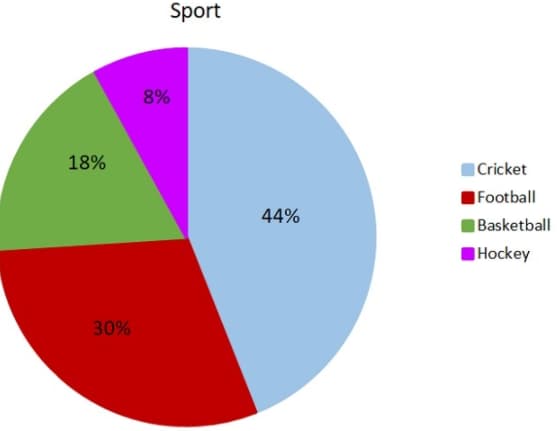
In the given pie-chart, if the school strength was , how many liked Cricket more than Hockey?
The given pie chart below informs us about non performing assets (NPA) of different banks till Dec. 2017.
If the total NPA of all the banks is Rs 300 lakh crore, then what will be the total NPA (in lakh crore) of bank ‘A’ till December 2017?
The marks obtained by a student in an examination are given below. The total marks out of obtained in various subjects are as follows:
| Subject | Marks |
| Marathi | |
| English | |
| Science | |
| Mathematics | |
| Total |
Represent the above data using pie diagram.
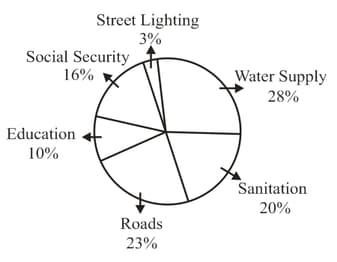
The above graph shows a municipality's expenditure on different services for the financial year . If the municipality spent a total of Rs. crore during this period, the expenditure on 'Education' was:


