The given table shows the displacement of a body at different times. Draw a displacement-time graph to describe the motion of the body.
Time (in s)
Displacement (in m)
Important Questions on Histogram, Pie Chart and Line Graph
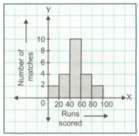
The given histogram shows the number of runs scored by a batsman in cricket matches
How many matches did he play in the highest run group?

The given histogram shows the number of runs scored by a batsman in cricket matches.
How many matches did he play in all?

The given histogram shows the number of runs scored by a batsman in 20-20 cricket matches.
In how many matches did he score less than runs?
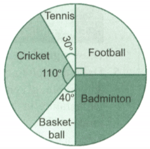
The pie graph given alongside shows the different games played by the students of class VIII. Study the pie graph.
Which game is played by the least number of students?
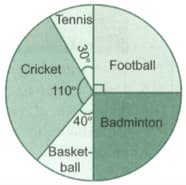
The pie graph given alongside shows the different games played by the students of class . Study the pie graph
If there are students in the class, how many of them play badminton?