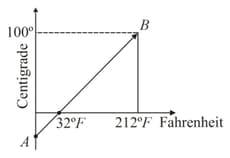
The graph shown in figure is a plot of temperature of a body in degree Celsius and degree Fahrenheit. Then
Important Questions on Thermometry, Thermal Expansion and Calorimetry
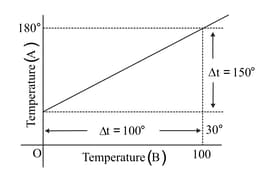
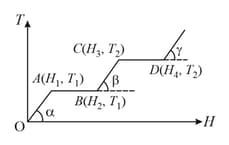
The graph between two temperature scales and is shown in the figure. Between upper fixed point and lower fixed point there are equal division on scale and on scale . The relationship for conversion between the two scales is given by
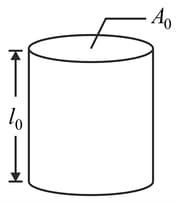
The figure shows a glass tube (linear coefficient of expansion is ) completely filled with a liquid of volume expansion coefficient . On heating, length of the liquid column does not change. Choose the correct relation between and .
The graph shows the variation of temperature of one kilogram of a material with the heat supplied to it. At , the substance is in the solid state. From the graph, we can conclude that
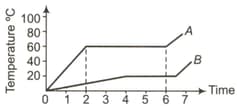
Two substances and of equal mass are heated at a uniform rate of under similar conditions. A graph between temperature and time is shown in the figure. The ratio of heat absorbed by them for complete fusion is
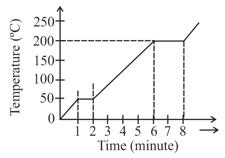
A student takes wax (specific heat and heats it till it boils. The graph between temperature and time is as follows. Heat supplied to the wax per minute and boiling point are respectively
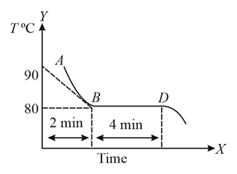
The figure given below shows the cooling curve of pure wax material after heating. It cools from to and solidifies along . If and are respective values of latent heat and the specific heat of the liquid wax, the ratio is