
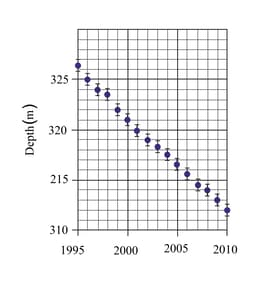
The graph below shows how the depth of the Dead Sea has changed over a period of . Each data point has an error bar which indicates that the actual level of the Dead sea lies somewhere within these bounds. Explain why it might not be possible to attribute an exact depth to the Dead sea for any given year. You should consider more than one factor.


Important Questions on Environment
The graph below shows how the depth of the dead sea has changed over a period of .

Add a line of best fit to a copy of the graph and find its gradient. Some people say that this graph might suggest that the dead sea might completely dry up one day. Using the graph and your value of the gradient, estimate the year in which it will dry up.
The graph below shows how the depth of the Dead sea has changed over a period of .

By finding the gradient of the best fit line drawn for the graph a student estimated the year at which the dead sea might dry up as 2332. Evaluate two factors that might affect this estimate.
The dead sea is a unique environment that is fed by the river Jordon. The rapid loss of water threatens its existence. As a result, there are various proposals to protect the Dead Sea. One scheme proposes that of water from the Red Sea is pumped into the Dead Sea every year. The water would have to be pumped along of pipes. Discuss one advantage and one disadvantage of this scheme.
The dead sea is a unique environment which is fed by the river Jordon. The rapid loss of water threatens its existence. As a result, there are various proposals to protect the Dead Sea. One scheme proposes that of water from the Red Sea is pumped into the Dead Sea every year. The water would have to be pumped along of pipes. The density of the sea water is . Calculate the volume of the water which would be pumped into the dead sea every year.
The Dead Sea has a surface area of about . Convert this into .
The dead sea is a unique environment which is fed by the river Jordon. The rapid loss of water threatens its existence. As a result, there are various proposals to protect the Dead Sea. One scheme proposes that of water from the Red Sea is pumped into the Dead Sea every year. The water would have to be pumped along of pipes. The density of the sea water is . If the surface area of the Dead Sea is , calculate the amount that the pumped water would raise the level of dead sea every year. Assume that there is no loss of sea level by any other means.
The dead sea is a unique environment that is fed by the river Jordon. The rapid loss of water threatens its existence. As a result, there are various proposals to protect the Dead Sea. The estimated decrease in the depth of the dead sea is approximately in a year. One scheme proposes that of water from the Red Sea is pumped into the Dead Sea every year. The water would have to be pumped along of pipes. The density of the sea water is . The surface area of the Dead Sea is . Calculate the amount that the pumped water would raise the level of the dead sea every year. Assume that there is no loss of sea level by any other means. Evaluate the effectiveness of this solution with reference to your calculations.


