
The graph below shows the nuclear radius of some nuclei in femtometers
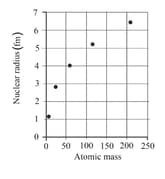
Draw a line of best fit on a copy of the graph.
Important Questions on Models
The graph below shows the nuclear radius of some nuclei in femtometers
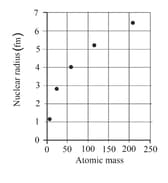
Use the graph to predict the radius of a nucleus of tungsten.
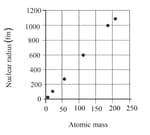
A model of the nucleus called the liquid drop model suggests that the volume of a nucleus is directly proportional to the number of protons and neutrons in it.
A graph of the volume of nuclei against mass number is shown below.

Using your value of the radius of tungsten from the first graph, calculate the volume of this nucleus. (Assume that the nucleus is a sphere).
A model of the nucleus called the liquid drop model suggests that the volume of a nucleus is directly proportional to the number of protons and neutrons in it.
A graph of the volume of nuclei against mass number is shown below.
How would you classify the trend of this graph
A model of the nucleus called the liquid drop model suggests that the volume of a nucleus is directly proportional to the number of protons and neutrons in it.
A graph of the volume of nuclei against mass number is shown below.

Add volume of tungsten to this graph.
A model of the nucleus called the liquid drop model suggests that the volume of a nucleus is directly proportional to the number of protons and neutrons in it.
A graph of the volume of nuclei against mass number is shown below.
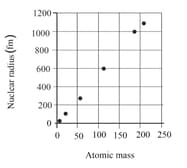
Discuss whether the liquid drop model of the nucleus appears to be a good model. You should refer to the graph in your answer.


