
The graph below shows the speed, in m/s, of a car as it comes to rest from a speed of m/s.
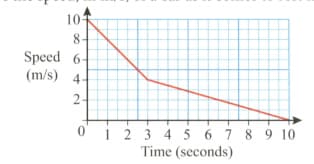
Calculate the distance travelled during the second period shown on the graph.
Important Questions on Ratio, Rate and Proportion
The graph below shows the speed, in m/s, of a car as it comes to rest from a speed of m/s.

Calculate the average speed of the car for this second period.
The diagrams below is the speed-time graph for a car journey.
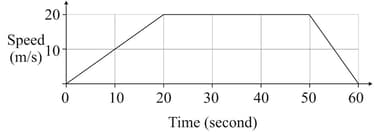
Calculate the acceleration during the first 20 seconds of the journey.
The diagram below is the speed-time graph for a car journey.

Calculate the acceleration during the last seconds of the journey.
The diagram below is the speed-time graph for a car journey.
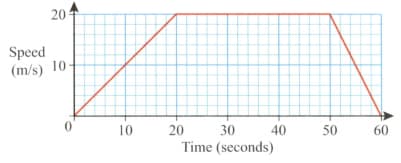
Calculate the average speed for the whole journey.
State whether the following proportion is direct proportion or not.
The length of a side of a square and its area.
State whether the following proportion is direct proportion or not.
The ages and heights of students.
State whether the following proportion is direct proportion or not.
The amount of money collected in a sponsored walk if you are paid per kilometre.
State whether the following proportion is direct proportion or not.
The time it takes to cover different distances at the same speed.


