
The graph given below shows how the speed of a car changes with time.
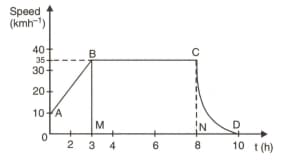
What is the maximum speed attained by the car?
Important Questions on Motion
The graph given below shows how the speed of a car changes with time.
Which part of the graph shows zero acceleration?
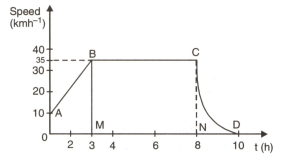
The graph given below shows how the speed of a car changes with time.

Which part of the graph represents varying retardation?
The graph given below shows how the speed of a car changes with time.

Find the distance traveled in the first eight hours.
Study the velocity-time graph and calculate the acceleration from to .
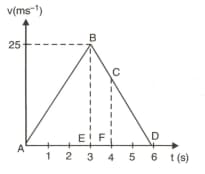
Study the velocity-time graph and calculate the acceleration from to .

Study the velocity-time graph and calculate the distance covered in the region .

Study the velocity-time graph and calculate the average velocity from to .

Study the velocity-time graph and calculate the distance covered in the region .


