
The graph given below shows the position of a body moving along the x-axis as a function of time
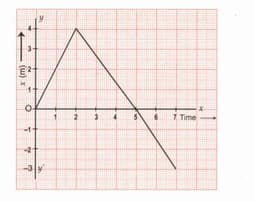
Answer the following: (a) Calculate the velocity (i) in first seconds (ii) between to seconds (iii) between to seconds.
(b) What is the position of the body at ? (i) (ii)
(c) What is the displacement of the body during the 7th s of motion?
Important Questions on Motion
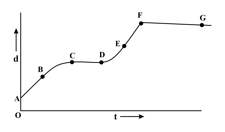
The Graph for a body is given below. State whether the velocity and acceleration of the body in the region AB, BC, DE, EF and FG are positive, negative, or Zero.
Using the following data plot the d-t graph of a moving car and answer the following questions:
| Time (a.m.) | 10.00 | 10.05 | 10.20 | 10.30 | 10.45 | 11.00 | 11.10 | 11.25 | 11.45 | 12.00 |
| Distance (km) | 0 | 5 | 10 | 22 | 25 | 30 | 34 | 40 | 50 | 55 |
(a) When was the car travelling at the greatest speed?
(b) What is the average speed of the car?
(c) What is the speed between to ?
(d) During a part of the journey, the car was forced to slow down to . During which period did this happen?
Derive the velocity-time relation using a speed-time graph
Derive the position-velocity relation using a speed-time graph.


