
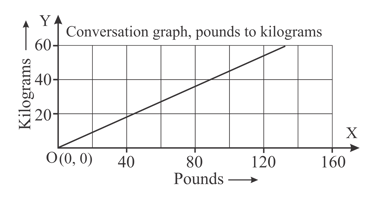
The graph is a conversion graph for kilometres and pounds. Check whether the given conversion is correct or not? If it is incorrect, find the correct value.
Important Questions on Understanding Measurement
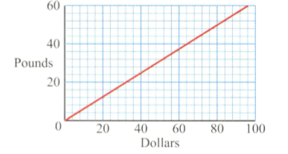
The graph shows the conversion between pounds and dollars, as shown on a particular website in February, . Use the graph to convert pounds to dollars.
The graph shows the conversion between pounds and dollars, as shown on a particular website in February, . Use the graph to convert pounds to dollars.

The graph shows the conversion between pounds and dollars, as shown on a particular website in February, . Use the graph to convert dollars to pounds.
The graph shows the conversion between pounds and dollars, as shown on a particular website in February, . Use the graph to convert dollars to pounds.
The cooking time (in minutes) for a joint of meat (in kilograms) can be calculated by multiplying the mass of the joint by and then adding . The graph shows the cooking time for different masses of meat. If a joint of this meat has a mass of approximately how long should it be cooked?

The cooking time (in minutes) for a joint of meat (in kilograms) can be calculated by multiplying the mass of the joint by and then adding . The graph shows the cooking time for different masses of meat. If a joint of meat is to be cooked for , approximately how much is its mass?
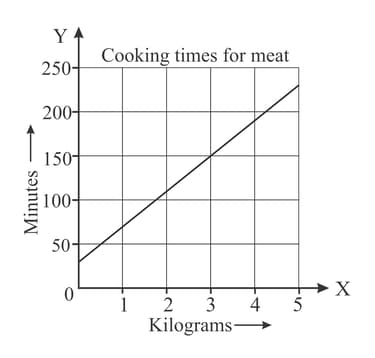
The cooking time (in minutes) for a joint of meat (in kilograms) can be calculated by multiplying the mass of the joint by and then adding . The graph shows the cooking time for different masses of meat. By calculating the mass of a piece of meat that takes only to cook, explain carefully why it is not possible to use this graph for every possible joint of meat.


