
The graph represents number of musical instruments purchased by Sam for his store.
It was found that there were some damages in the instruments bought.
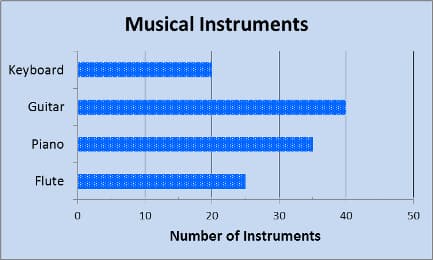
- One-fifth of the flutes were damaged.
- One-tenth of the guitars were damaged.
How many damaged flutes and guitars does Sam have to return?
It was found that there were some damages in the instruments bought.
Important Questions on Smart Charts

Look at the picture and fill in the blanks:
The length of Geeta’s hand is _____ (more/less) than Rohan’s hand.
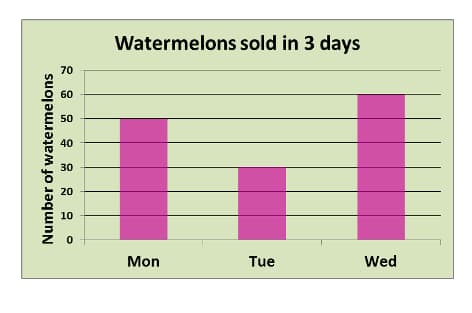
After the sale he is left with more watermelons.
To begin with he had _____ watermelons.
(Please enter only numerals)
The bar graph represents number of white and grey pigeons in different parks.
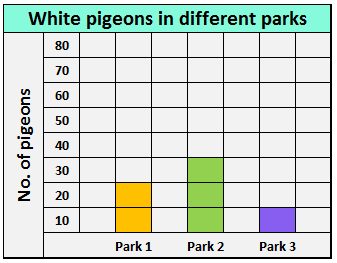
Total number of pigeons in Park _____ .
(Please enter only numerals)
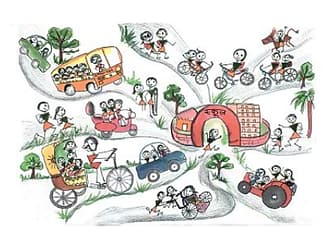
Look at the picture and fill in the blank.
| Way of coming | Tractor | Bicycle | Walking | Car | Rikshaw |
| Number of students |
The least students come to school by _____.
The table represents the grades awarded for the marks scored.
| Grades | |||||
| Marks | to | to | to | to | to |
The incomplete bar graph represents Mid-term Mathematics scores of grade students.
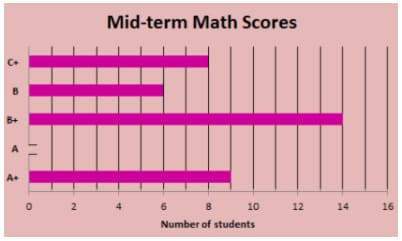
If there were students who scored more than then number of students who received ‘A’ grade in Mathematics is _____.
(Please enter only numerals)
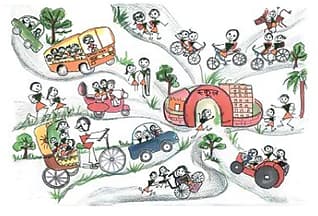
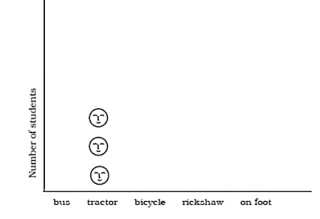
Look at the picture and fill in the table.
| Way of coming | Bus | Tractor | Bicycle | Rickshaw | on foot |
| Number of students |
Draw faces in the chart to show how many children come by bus, bicycle, rickshaw or on foot.
The bar graph represents the production of rice at Richard’s rice mill for the past months.
He donated one-fourth of his production to feed the cyclone affected people in his village.
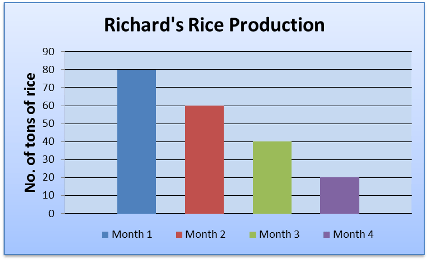
How many kilograms of rice did Richard donate to the cyclone affected people?
[Assume ton kilograms]
The bar represents the hobbies of students in grade .
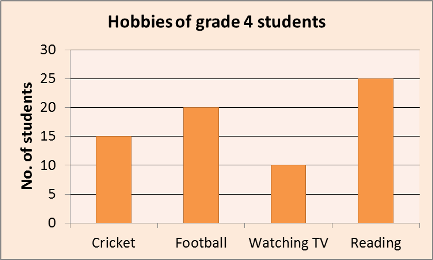
Based on the hobbies, the class teacher arrived at the below results.
- Children who watch TV everyday will have good reading skills.
- Children who play outdoor games everyday score better in Math and Science.
- Children who read magazines score better in Social Science and English.
Rohan, Jacob and Geeta also measured their hands. They stuck their strips as shown.

Look at the picture and fill in the blank:
The length of Jacob’s hand is _____ (more/less) than Geeta’s hand.
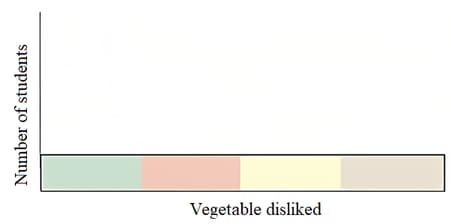
Which vegetable is most disliked? Ask your friends and complete the table.
| Vegetable disliked | Number of students |
Use this table to draw faces in the chart below. Draw  for each child on top of the vegetable disliked.
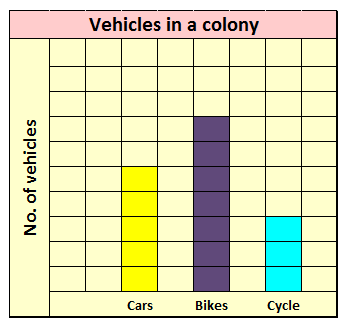
What is an important information that is missing to find total number of vehicles in the colony?
Rohan, Jacob and Geeta also measured their hands. They stuck their strips as shown.
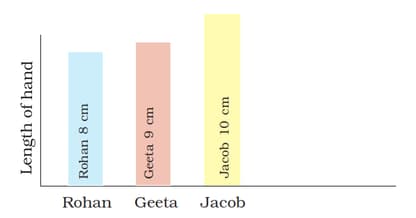
Who has the longest hand
The bar graph represents the different types of dresses manufactured by Mike’s factory.
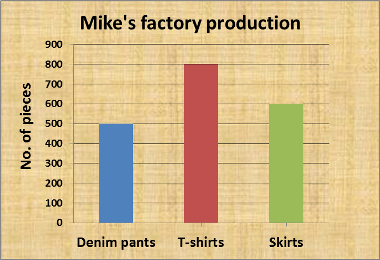
During the final stage, it was found that Denim pants, T-shirts and Skirts were damaged. Identify the table which represents the undamaged dresses for delivery.
The table represents the money collected by different grades for a social cause.
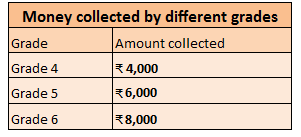
Identify the graph which represents the table.
Identify the graph which represents the table.

Look at the picture and fill in the blanks:
_____ has the shortest hand.


