
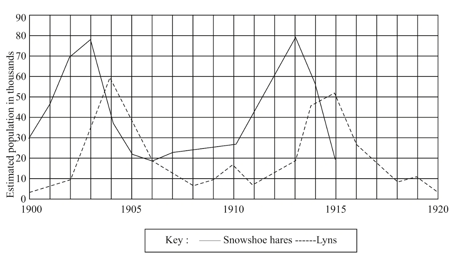
The graph shows how the estimated population of snowshoe hares and lynx in one part of Canada changed over 20 years.
Year
1916
1917
1918
1919
1920
Estimated number of snowshoe hares (in thousand)
28
16
9
12
5
a) Use the data shown in the table to finish plotting the line for the snowshoe hares.
b) Describe how the population of Lynx changed between 1913 and 1917.
c) When the snowshoe hare population increased, the Lynx population also started to increase. Explain why.
Important Questions on Ecology
Some scientists monitored the population of Cabomba plants in a lake over a period of 6 months.
| Month | January | February | March | April | May | June |
| Number of plants | 765 | 768 | 772 | 483 | 212 | 167 |
Between which months did the number of Cabomba begin to decrease?
Some scientists monitored the population of Cabomba plants in a lake over a period of 6 months.
| Month | January | February | March | April | May | June |
| Number of plants | 765 | 768 | 772 | 483 | 212 | 167 |
List two possible reasons for the decrease in the population of Cabomba plants.
An increase in the human population causes an increase in the demand for electricity.
Name two fossil fuels that are burned to generate electricity.


