
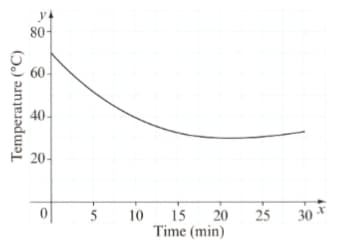
The graph shows how the temperature of some water is changing.

Copy and complete this table.
Time (min)
Temperature ()
Important Questions on Graphs
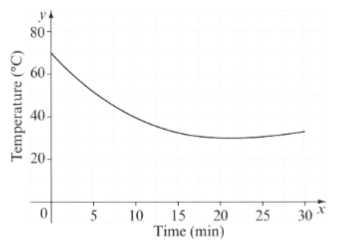
The graph shows how the temperature of some water is changing.

The water is not cooling at the same rate all the time. Describe how the rate of cooling change. Give a reason for your answer.
The graph shows how the temperature of some water is changing.

The water stops cooling when it is at room temperature. Use the graph to estimate room temperature.
The graph shows how the temperature of some water is changing.

The gradient of the curve varies.
Describe when the gradient is positive.
The graph shows how the temperature of some water is changing.
The gradient of the curve varies.
Describe when the gradient is negative.
The graph shows how the temperature of some water is changing.
The gradient of the curve varies.
Describe when the gradient is zero.

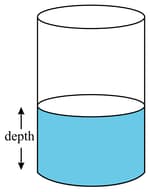
A vase has the shape of a cylinder. The vase is being filled at a constant rate with water from a tap.

This graph shows how the depth of the water in the vase changes with time.
Find the sum of the depth of water(in ) after seconds.
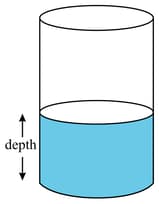
A vase has the shape of a cylinder. The vase is being filled at a constant rate with water from a tap.

This graph shows how the depth of the water in the vase changes with time.
When (in seconds) is the depth centimetres?
A vase has the shape of a cylinder. The vase is being filled at a constant rate with water from a tap.
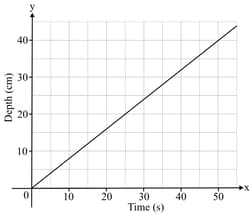
This graph shows how the depth of the water in the vase changes with time.
Work out the rate at which the depth is increasing, in centimetres per second.


