
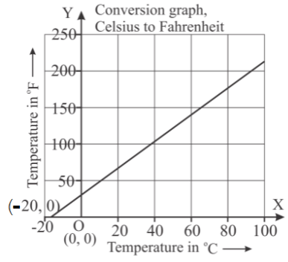
The graph shows the relationship between temperature in degrees Celsius and degree Fahrenheit . Use the graph to convert to

Important Questions on Understanding Measurement
The graph shows the relationship between temperature in degrees Celsius and degree Fahrenheit . Use the graph to convert to
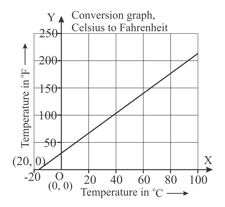
The graph shows the relationship between temperature in degrees Celsius and degree Fahrenheit . Use the graph to convert to

The graph shows the relationship between temperature in degrees Celsius and degree Fahrenheit . Use the graph to convert to
The graph is a conversion graph for kilometres and pounds. What does one small square on the horizontal axis represent?
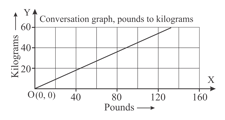
The graph is a conversion graph for kilometres and pounds. What does one small square on the vertical axis represent?

The graph is a conversion graph for kilometres and pounds. Change to ?

The graph is a conversion graph for kilometres and pounds. The minimum mass to qualify as an amateur lightweight boxer is . What is this in pounds?
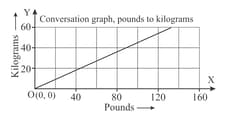
The graph is a conversion graph for kilometres and pounds. Check whether the given conversion is correct or not? If it is incorrect, find the correct value.


