
The heights, in centimetres, of children are represented in the following diagram.
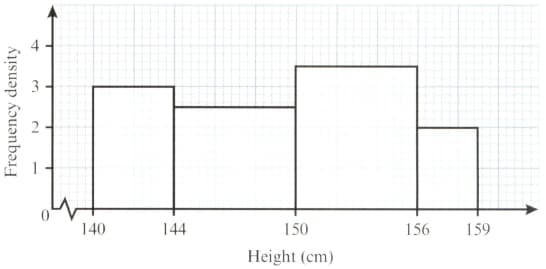
The children are split into two equal-sized groups: a 'tall half' and a 'short half'.
Calculate an estimate of the difference between the mean heights of these two groups of children.
Important Questions on Measures of Central Tendency
The following table summarises the number of tomatoes produced by the plants in the plots on a farm.
| No. tomatoes | ||||
| No. plots |
Calculate an estimate of the mean number of tomatoes produced by these plots.
The following table summarises the number of tomatoes produced by the plants in the plots on a farm.
| No. tomatoes | ||||
| No. plots |
The tomatoes are weighed accurately and their mean mass is found to be grams. At market they are sold for per kilogram and the total revenue is Find the actual mean number of tomatoes produced per plot.
The following table summarises the number of tomatoes produced by the plants in the plots on a farm.
| No. tomatoes | ||||
| No. plots |
The tomatoes are weighed accurately and their mean mass is found to be grams. At market they are sold for per kilogram and the total revenue is . Why could be the mean inaccurate?
Twenty boys and girls were each asked how many aunts and uncles they have. The entry in the following table, for example, shows that boys and girls each have aunts and uncles.
| B/G | Aunts | ||||
| Uncles | |||||
Find the mean number of uncles that the boys have.
Twenty boys and girls were each asked how many aunts and uncles they have. The entry in the following table, for example, shows that boys and girls each have aunts and uncles.
| B/G | Aunts | ||||
| Uncles | |||||
For the boys and girls together, calculate the mean number of aunts.
Twenty boys and girls were each asked how many aunts and uncles they have. The entry in the following table, for example, shows that boys and girls each have aunts and uncles.
| B/G | Aunts | ||||
| Uncles | |||||
For the boys and girls together, calculate the mean number of aunts and uncles.
Twenty boys and girls were each asked how many aunts and uncles they have. The entry in the following table, for example, shows that boys and girls each have aunts and uncles.
| B/G | Aunts | ||||
| Uncles | |||||
Suggest an alternative way of presenting the data so that the calculations in parts and would be simpler to make.
A calculated estimate of the mean capacity of refrigerators stored at a warehouse is litres. The capacities are given in the following table.
| Capacity (litres) | ||||
| No. refrigerators |
A delivery of new refrigerators, all with capacities between and litres arrives at the warehouse. This causes the mean capacity to decrease by litres. Find the value of and state what assumptions you are making in your calculations.


