
The heights of students in a class are indicated as below:
Name of students
Shyam
Mohindra
Joy
Viraj
George
Height (in cm)
Represent their heights by bar graph and pie chart.
Important Questions on Data Handling
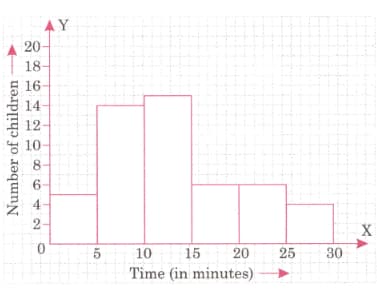
The histogram given alongside shows the time taken by six-year-old children to eat their lunch at school.
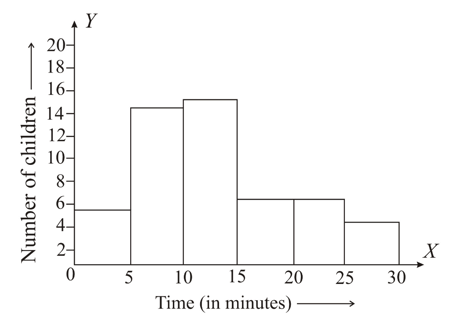
What is the class size?
The histogram given alongside shows the time taken by six-year-old children to eat their lunch at school.
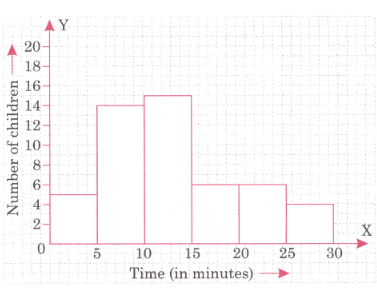
How many children finished their lunch in less than minutes?
The histogram given alongside shows the time taken by six-year-old children to eat their lunch at school.

How many children needed more than minutes to finish their lunch?
The histogram given alongside shows the time taken by six-year-old children to eat their lunch at school.
How many children needed more than minutes to finish their lunch?
The histogram given alongside shows the time taken by six-year-old children to eat their lunch at school.

How many children needed more than but less than minutes to finish their lunch?
A restaurant in Mumbai had customers on Saturday evening. They spent the following amount in rupees:
Use classes (in ) of and to make a frequency table.
A restaurant in Mumbai had customers on Saturday evening. They spent the following amount in rupees:
Prepare a histogram of the data from the frequency table you have prepared.
The following table shows the frequency distribution of marks of students in an examination:
| Class | ||||||||||
| Number of students |
Draw a histogram depicting the above data.


