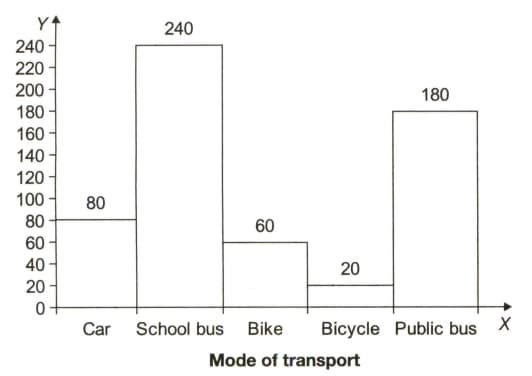
The histogram shows the number of students using different modes of transport to commute from residence to school. From the bar graph, answer the following questions
The number of pupils who travel by bike is times than that of the number of pupils who travel by

Important Questions on Statistics
The histogram shows the number of students using different modes of transport to commute from residence to school. From the bar graph, answer the following questions
If girls travel to school by bicycle, then how many boys travel by bicycle?
The histogram shows the number of students using different modes of transport to commute from residence to school. From the bar graph, answer the following questions
The ratio of the number of pupils who travel by school bus and who travel by public bus is

A line graph given below shows the number of text messages received by Keerthi during a week. Study the graph carefully and answer the questions that follows
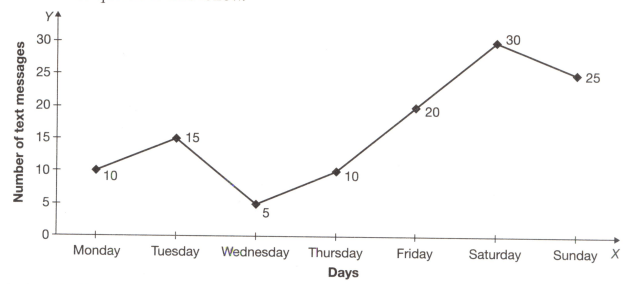
On which day did Keerthi receive the lowest number of text messages?
The line graph given below shows the number of text messages received by Keerthi during a week. Study the graph carefully and answer the questions that follow.

(ii) On Which day did Keerthi receive exactly messages?
The line graph given below shows the number of text messages received by Keerthi during a week. Study the graph carefully and answer the questions that follow.
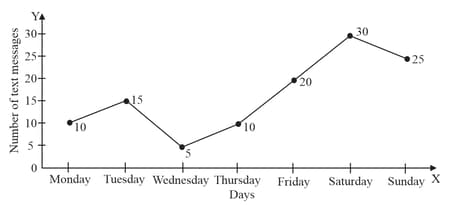
(iii) Find the total number of text messages received by Keerthi in the week.
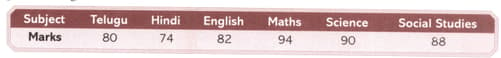
The following table shows the marks scored by a student in an annual examination in various subjects. Draw a histogram to represent the given data.