
The initial activity a sample of 1 mole of radon-220 is .
Calculate:
(b) the half-life of the isotope.
Important Questions on Nuclear Physics
The graph of count rate against time for a sample containing indium-116 is shown.
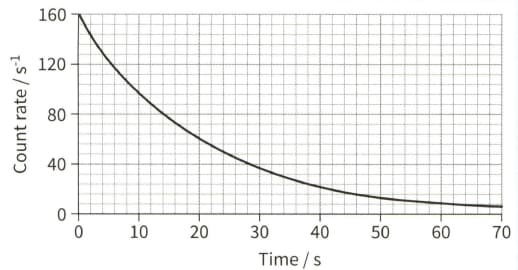
(a) Use the graph to determine the half-life of the isotope.
The graph of count rate against time for a sample containing indium-116 is shown.
(b) Calculate the decay constant.
The proportions of different isotopes in rocks can be used to date the rocks. The half-life of uranium-238 is years. A sample has of the proportion of this isotope compared with newly formed rock.
(a) Calculate the decay constant in for this isotope of uranium.
The proportions of different isotopes in rocks can be used to date the rocks. The half-life of uranium-238 is years. A sample has of the proportion of this isotope compared with newly formed rock.
(b) Calculate the age of the rock in years.
The table shows the received count rate when a sample of the isotope vanadium- decays.
(a) (i) Sketch a graph of the count rate against the time.
The table shows the received count rate when a sample of the isotope vanadium- decays.
(a) (ii) Comment on the scattering of the points.
The table shows the received count rate when a sample of the isotope vanadium- decays.
(b) From the graph, determine the half-life of the isotope.
The table shows the received count rate when a sample of the isotope vanadium- decays.
(c) Describe the changes to the graph that you would expect if you were given a larger sample of the isotope.


