
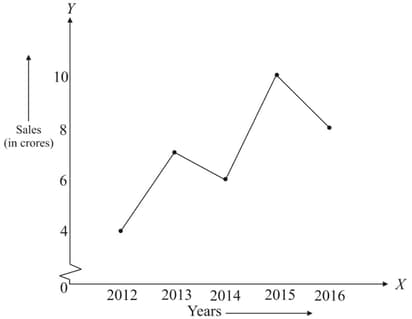
The line graph given below shows the yearly sales figures for a manufacturing company during the last five years.

Study the above graph carefully and answer the question given below.
Compute the difference between the sales in and ?
Important Questions on Line Graphs and Linear Graphs
The line graph given below shows the yearly sales figures for a manufacturing company during the last five years.
Study the above graph carefully and answer the question given below.
In which year was there the greatest difference between the sales as compared to its previous year?
The following is the distance-time graph of Amit's walking.
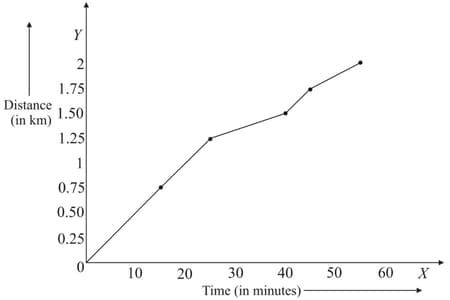
Study the above graph carefully and answer the question given below:
When does Amit make the least progress? Explain your answer.
The following is the distance-time graph of Amit's walking.

Study the above graph carefully and answer the question given below:
Find his average speed in .
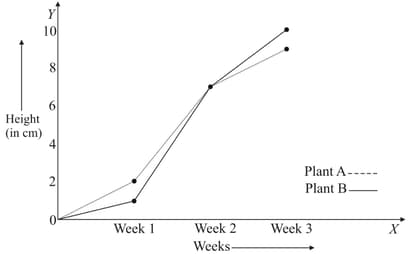
For an experiment in botany, two different plants, plant and plant , were grown under similar laboratory conditions. Their heights were measured at the end of each week for three weeks. The results are shown by the line graph given below:

Study the above graph carefully and answer the question given below:
How high was plant after weeks?
For an experiment in botany, two different plants, plant and plant , were grown under similar laboratory conditions. Their heights were measured at the end of each week for three weeks. The results are shown by the line graph given below:

Study the above graph carefully and answer the question given below:
How much did plant grow during the week?
For an experiment in botany, two different plants, plant and plant , were grown under similar laboratory conditions. Their heights were measured at the end of each week for three weeks. The results are shown by the line graph given below:

Study the above graph carefully and answer the question given below:
How much did plant grow from the end of the week to the end of the week?
For an experiment in botany, two different plants, plant and plant , were grown under similar laboratory conditions. Their heights were measured at the end of each week for three weeks. The results are shown by the line graph given below:
Study the above graph carefully and answer the question given below:
During which week did plant grow most?


