
The marks obtained out of by students in Mathematics and Physics are given below. Draw a double bar graph to represent the data.
Students
Alka
Babita
Charlie
Siddique
Uma
Mathematics
Physics
Important Questions on Data Handling
The scores obtained by students in an examination (out of ) are as follows:
.
The range of the scores is _____.
The scores obtained by students in an examination (out of ) are as follows:
.
The mode of the scores is _____.
The scores obtained by students in an examination (out of ) are as follows:
.
The median of the scores is _____.
The scores obtained by students in an examination (out of ) are as follows:
.
The mean of the data is _____.
The following bar graph shows the number of sandwiches sold during a week in a college canteen in the morning and the evening time.

Based on the given bar graph, answer the following question.
How many sandwiches were sold on Monday morning?
The following bar graph shows the number of sandwiches sold during a week in a college canteen in the morning and the evening time.
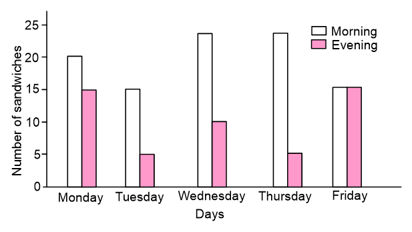
Based on the given bar graph, answer the following question.
The total number of sandwiches that were sold on Wednesday was _____.
The following bar graph shows the number of sandwiches sold during a week in a college canteen in the morning and the evening time.

Based on the given bar graph, answer the following question.
On which day were the same number of sandwiches sold in the morning and evening?
The following bar graph shows the number of sandwiches sold during a week in a college canteen in the morning and the evening time.

Based on the given bar graph, answer the following question.
The number of sandwiches that were sold on Tuesday evening was _____.


