
The most common representative value of a group of data is their
Important Questions on Data Handling
Population of city A, B and C from
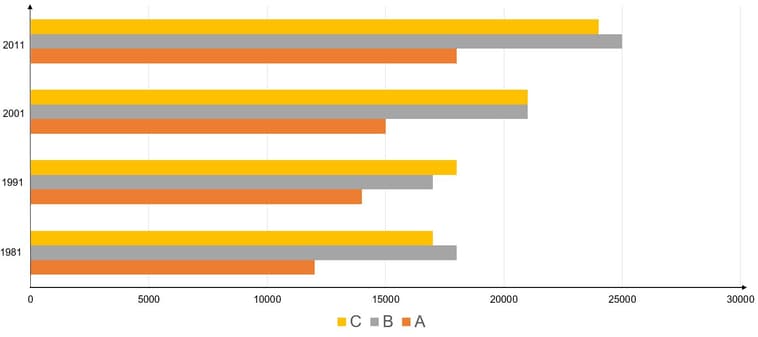
Choose the correct statement:
Following are the points obtained by a Kabaddi team in various matches.
The median of the points obtained by the team will be
The rainfall (in ) in a city on days of a certain week was recorded as follows:
| Day | Monday | Tuesday | Wednesday | Thursday | Friday | Saturday | Sunday |
|---|---|---|---|---|---|---|---|
Rainfall (in ) |
If the range of rainfall in the above data is , then find the value of .
The marks (out of ) obtained by students in a mathematics test are listed as below:
The number of students who obtained marks more than or equal to is ____
The marks (out of ) obtained by a group of students in a science test are and Find the:
Mean marks obtained by the group.
The marks (out of ) obtained by a group of students in a science test are
and .
Find the range of the marks obtained.
A dice was thrown times and the following outcomes were recorded:
Arrange the above data in ascending order and prepare the frequency table.
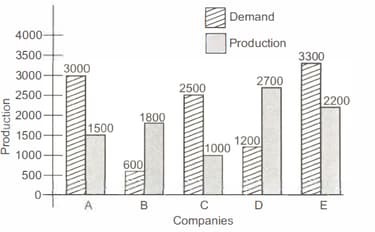
What is the difference between average demand and average production of the five companies taken together?
The heights of girls were measured in and the results are as follows:
If the range of the data is , find the value of .

The heights of girls were measured in and the results are as follows:
If the height of the shortest girl is , then find the value of .
(i) What is the range of the data?
(ii) What ¡s the mean height of the students?
(iii) How many students are there whose height is more than the mean height?
where and stands for Apple, Banana, Grapes, Mango and Orange respectively.
Which two fruits are liked by an equal number of students?
.
Arrange the data in ascending order.


