
The number of animals in five villages are as follows:
Village
A
B
C
D
E
Number of animals
Prepare a pictograph of these animals using one symbol to represent animals.
Important Questions on Data Handling
The following pictograph shows different subject books which are kept in a school library.
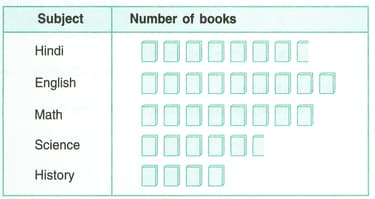
Taking symbol of one book books, find:
how many History books are there in the library?
The following pictograph shows different subject books which are kept in a school library.

Taking symbol of one book books, find that how many Science books are there in the library?
The following pictograph shows different subject books which are kept in a school library.

Taking symbol of one book books, find:
which books are maximum in number?
The following table gives the number of students in class VI in a school during academic year to .
| Academic years | |||||
| No. of students |
Represent the above data by a bar graph.
The attendance of a particular for the six days of a week are as given below :
| Day | Monday | Tuesday | Wednesday | Thursday | Friday | Saturday |
| Attendance |
Draw a suitable bar graph.
The total number of students present in class VI B, for the six days in a particular week were as given below. Draw a suitable bar graph.
| Day | Monday | Tuesday | Wednesday | Thursday | Friday | Saturday |
| No.of students present |
The following table shows the population of a particular city at different years :
| Year | |||||
| Population in Lakh |
Represent the above information with the help of a suitable bar graph.
In a survey of families of a colony, the number of children in each family was recorded and the data has been represented by the bar graph, given below:
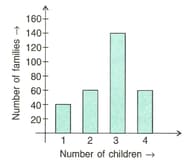
Read the graph carefully and answer the following question:
How many families have children each?


