
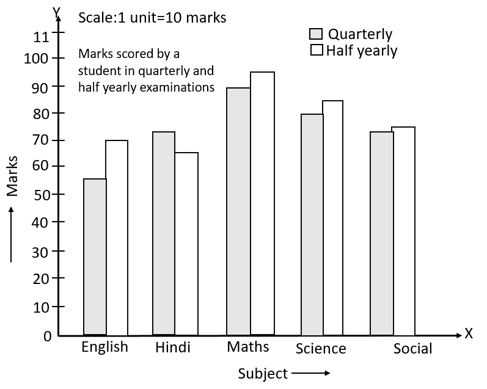
The performance of Rahul in the quarterly and half-yearly examinations is shown in the above double bar graph.
In which subject has the student improved his performance the most?
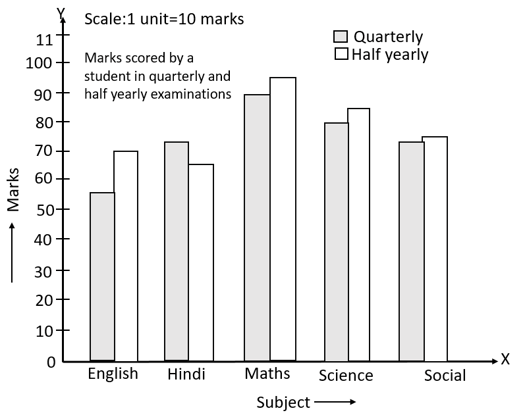
Important Questions on Data Handling
The performance of Rahul in the quarterly and half yearly examinations is shown using the double bar graph.
Study the given double bar graph and answer the following questions:
In which subject is the improvement the least?
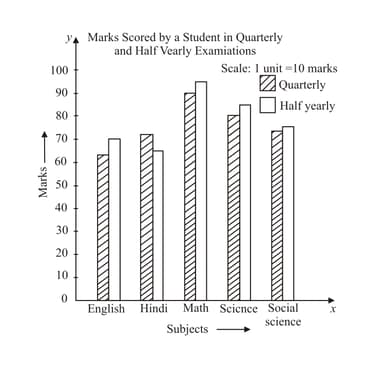
Has the performance gone down in any subject? (Write Yes/No)
The following data shows the sale of watches and sunglasses in a store during six months. Use a double graph for the given data to answer these questions.
| January | February | March | April | May | June | |
|---|---|---|---|---|---|---|
| Watches | ||||||
| Sunglasses |
In which month was the difference in the sales of watches and sunglasses the maximum?
The following data shows the sale of watches and sunglasses in a store during six months. Use a double graph for the given data to answer these questions.
| January | February | March | April | May | June | |
|---|---|---|---|---|---|---|
| Watches | ||||||
| Sunglasses |
In which month was the ratio of sale of watches to sunglasses ?
| English | Hindi | Mathematics | Science | Social science | |
|---|---|---|---|---|---|
| Riya | |||||
| Siya |
Who performed better in languages?
| English | Hindi | Mathematics | Science | Social science | |
|---|---|---|---|---|---|
| Riya | |||||
| Siya |
In which subject did Siya and Riya score equal marks?
| English | Hindi | Mathematics | Science | Social science | |
|---|---|---|---|---|---|
| Riya | |||||
| Siya |
In which subjects was Riya better than Siya?
| English | Hindi | Mathematics | Science | Social science | |
|---|---|---|---|---|---|
| Riya | |||||
| Siya |
Find the average marks scored by both the girls and hence compare their performance.


