
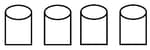
The picture graph shows the capacity of containers. Which container has a capacity of litre?
Bottle
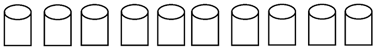
Flask
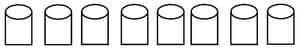
Mug
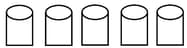
Glass
 represents .
represents .Important Questions on Data Handling
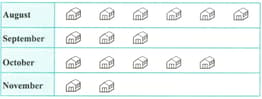
If  represents houses, how many houses were built in the given months.
The table shows the number of TV sets sold at Diwakar's store.
Make a pictograph by using pictures or stickers:
|
July |
|
| August | |
| September | |
| October |
The table below shows the number of students playing four different games.
| Games | Number of students |
| Football | |
| Hockey | |
| Cricket | |
| Badminton |
Present this information as a pictograph. You can use stickers to make the pictographs.
Draw pictographs to illustrate the following sets of results:
Survey of the number of absentees from a class this week.
Monday , Tuesday , Wednesday , Thursday , Friday , Saturday .
Use the bar graph shown below to answer the following.
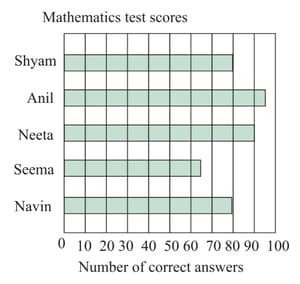
Who scored the highest marks in the test? What is this score?
Use the bar graph shown below to answer the following.

Who scored the lowest marks in the test? What is the score?
Use the bar graph shown below to answer the following.
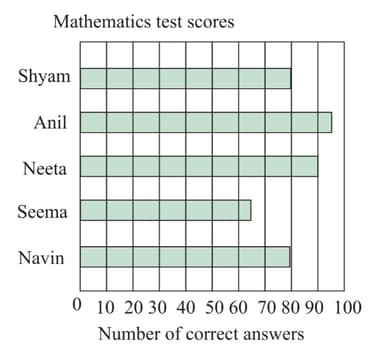
Did any of the students obtain the same score? Who were they? What score did they obtain?
Use the bar graph shown below to answer the following.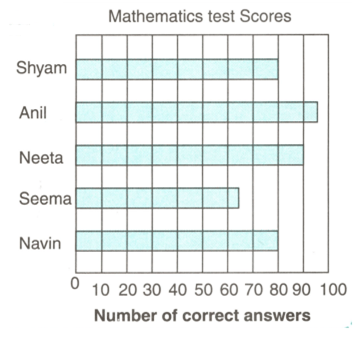
What score is represented by each segment on the horizontal number line?


