
The pie chart given below shows the break-up of the cost of construction of a house. Assuming that the total cost of construction is , answer the questions given below.
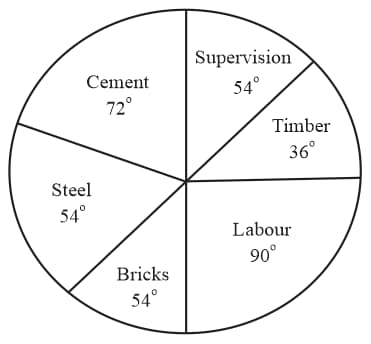
The amount spent on cement, steel and supervision is what per cent of the total cost of construction.
Important Questions on Statistics
In " less than type ogive'', the axis represents
The given table represents the exports (in ₹ crores) of four items A, B, C and D over a period of six years. Study the table and answer the question that follows.
|
Items Year |
A | B | C | D |
In which year, the exports of item were the average exports of item during six years;
coordinate of intersecting point of two ogives, represents
The HR department of a company prepared a report. The pie chart from this report shows number of employees in all the departments that the company has. Study the diagram and answer the following questions.
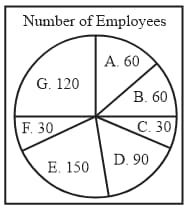
If the average monthly salary of the employees of this company is then, what is the total of the salaries (in lacs) paid to all the employees of this company?
The given table represents the exports ( incrores) of four items and over a period of six years. Study the table and answer the question that follows:
| Items | ||||
| Years | ||||
The total exports of item from to is what percentage less than the total exports of all the four items in :(Correct to one decimal place)
| No. of Accidents | ||||||||
| Frequency |
In how many cases or more accidents occur ?
The given pie chart shows information about Non–Peforming Assets (NPA) Processed by the various banks of India till December 2017.
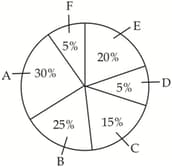
If the total NPAs under all the banks are worth Rs. lakh crores, then NPAs worth how much (in Rs. lakh crores) does Bank ‘D’ contain till December 2017?
Using the pie-chart answer the following:
If the annual income of the family is , the savings is:
The given pie chart below informs us about non performing assets (NPA) of different banks till Dec. 2017.
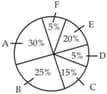
If the total NPA of all the banks is Rs 300 lakh crore, then what will be the total NPA (in lakh crore) of bank ‘A’ till December 2017?
| Class | |||||
| Frequency |
The cumulative frequency of the class of the above frequency distribution is _____.
The following table gives the frequency of vowels used in the page of a book.
| Vowels | a | e | i | o | u |
| Frequency |


