
The pie chart represents the distribution of population in a village.
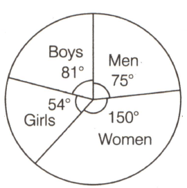
Calculate the percentage of the population in the village who are girls.
Important Questions on Introduction to Graphs
The pie chart represents the distribution of population in a village.

If there are boys in the village, calculate the total population of the village.
The quantity of petrol filled in a car and the cost of petrol are given in the following table :
| Quantity of petrol (in ) | ||||
| Cost of petrol (in ) |
Draw a line graph representing the above data. Also, find the cost of of petrol using the graph. How must petrol be purchased for ?
If the simple interest on a certain sum is per year. Then, , where is the number of years.
Draw a graph for the above function.
If the simple interest on a certain sum is per year. Then, , where is the number of years.
From the graph, find the value of , when, and
Draw a histogram to represent the following data.
| Class Interval | |||||
| Frequency |
If and coordinates are related to , then draw the graph by taking and , also find the values of when and .
The following graph shows the number of girls who have different types of hobbies. Study the graph carefully and answer the question that follows.
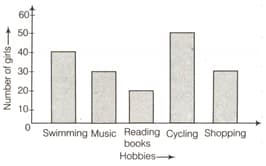
Which is the most popular hobby among the girls?


