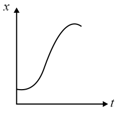
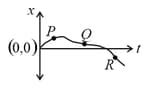
The position time graph of a moving particle is shown. Then which of the below best represents its velocity time graph :
Important Questions on Motion in a Straight Line
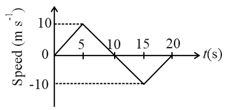
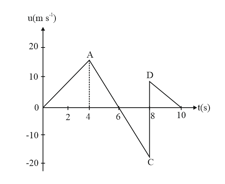
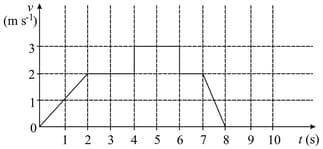
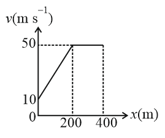
The following figure shows the speed-time graph of a particle moving along a fixed direction. The distance travelled by the particle between time to is
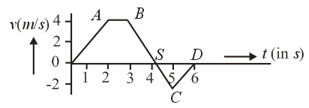
The velocity and time graph of a body in a straight line motion is shown in the figure. The point is at seconds. The total distance covered by the body in is :
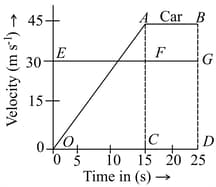
The velocity time graphs of a car and a scooter are shown in the figure. (i) The difference between the distance travelled by the car and the scooter in 15 s and (ii) the time at which the car will catch up with the scooter are, respectively.
Acceleration-time graph of a body moving in a straight line is as shown in figure. The body started its motion from rest.
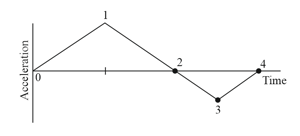
At which point is the body moving with the largest speed?
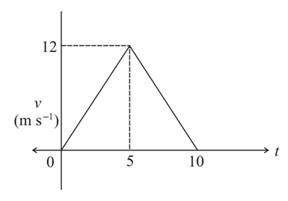
The velocity-time graph of a body moving in a straight line is shown in figure. Find the displacement and distance travelled by the body in seconds.
A particle starts from the origin at time and moves along the positive axis. The graph of velocity with respect to time is shown in figure. What is the position of the particle at time
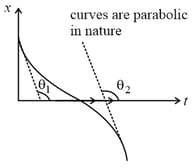
If the velocity-time graph has the shape what would be the shape of the corresponding acceleration-time graph?
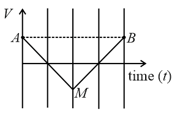
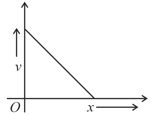
The velocity-displacement graph of a particle is shown in the figure.
The acceleration-displacement graph of the same particle is represented by :
The velocity-displacement graph describing the motion of a bicycle is shown in the figure.
The acceleration-displacement graph of the bicycle's motion is best described by :
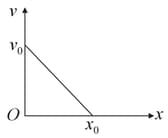
The given graph shows the variation of velocity with position for a particle moving along a straight line
Which of the following graph shows the variation of acceleration with position