
The principal of a school keeps a daily record of how many pupils are absent from each class. He records this information on the bar graph each week. The graph below shows the absentees for each class in one week.
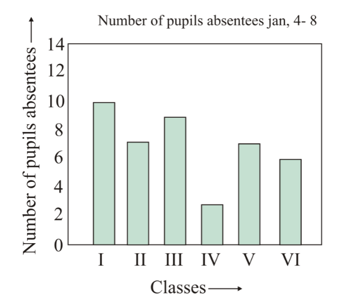
What is shown along the vertical axis?
What is shown along the vertical axis?
Important Questions on Data Handling
The principal of a school keeps a daily record of how many pupils are absent from each class. He records this information on the bar graph each week. The graph below shows the absentees for each class in one week.

Which class had the most absentees?
The principal of a school keeps a daily record of how many pupils are absent from each class. He records this information on the bar graph each week. The graph below shows the absentees for each class in one week.

Which class had the same number of absentees?
Draw bar graphs to show the following.
| Days | Attendance in class |
| Monday | |
| Tuesday | |
| Wednesday | |
| Thursday | |
| Friday | |
| Saturday |
Draw the bar graph to show the following.
| Pupils | Weight |
| Anil | |
| Arun | |
| Sudhir | |
| Naresh | |
| Prem | |
| Bobby |
Draw the bar graph to show the following.
| Players | Runs scored |
| Sachin Tendulkar | |
| Sourav Ganguly | |
| Rahul Dravid | |
| Virender Sehwag | |
| Yuvraj Singh | |
| Mohd. Kaif |
Draw the bar graph to show the following.
| Space Flights | Days in Flight |
| Apollo | |
| Apollo | |
| Apollo | |
| Apollo | |
| Apollo |
Using the bar graph choose the correct option in the questions given below.
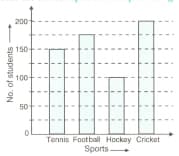
The most popular sports is
Using the bar graph choose the correct option in the questions given below.
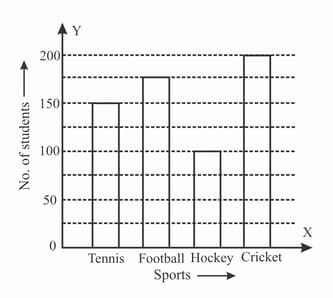
The difference between the number of students playing football and hockey is


