
The representation of data using pictures or symbols is called a .
Important Questions on Data Handling
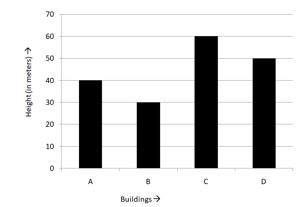
The building that is tall is
The pictograph given below shows the number of deliveries made by a florist during a week.
| Monday | 💐💐💐 |
| Tuesday | 💐💐 |
| Wednesday | 💐💐💐💐 |
| Thursday | 💐💐💐💐💐 |
| Friday | 💐💐💐 |
| Saturday | 💐💐💐💐💐💐 |
| Sunday | 💐💐💐💐💐💐💐 |
Each 💐 represents three deliveries.
The number of deliveries were maximum on
The pictograph given below shows the number of deliveries made by a florist during a week.
Each  represents deliveries represents deliveries |
|
| Monday | |
| Tuesday | |
| Wednesday | |
| Thursday | |
| Friday | |
| Saturday | |
| Sunday | |
Which two consecutive days have a total of deliveries?
The total number of students of a school in different years is shown in the following table:
| Year | |||||
| Number of students |
Prepare a pictograph of students using one symbol  to represent students and answer the following question.
How many symbols represent the total number of students in the year ?
| Year | |||||
| Number of Students |
Prepare a pictograph of students using one symbol
 to represent students and answer the following question.
How many symbols represent the total number of students in the year ?
Make a bar graph for the given data and answer the following questions:
| Movie preferences of women polled at a Mall | ||||
| Comedy | Drama | Sci-Fi | Action | Thriller |
Which type of movie is the most liked by women?
Make a bar graph for the given data and answer the following questions:
Movie preferences of women polled at a Mall
| Comedy | Drama | Sci-Fi | Action | Thriller |
What is the total number of women who have a preference for comedy and drama?


