The scatter graph shows the value (in of small cars of different ages (in years). The value of large cars is shown in the table. Predict the value of a 5-year-old small car and a 5-year-old large car. Compare these values.
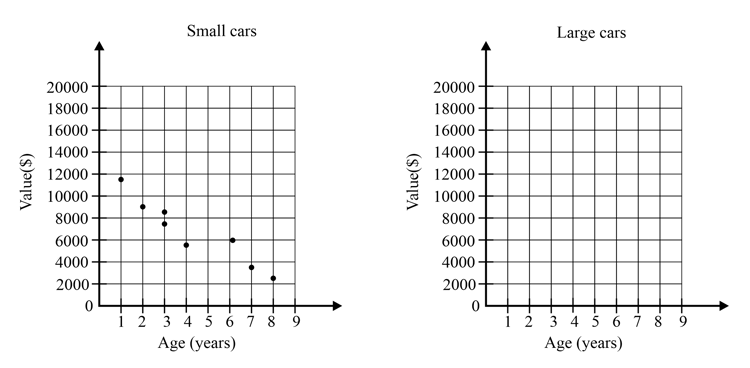
Age (years)
Value
Important Questions on Presenting and Interpreting Data 2
| Stroke | Frequency | Angle |
|
Front crawl |
||
| Back crawl | ||
| Breast crawl | _____ |
| Stroke | Frequency | Angle |
|
Front crawl |
||
| Back crawl | _____ | |
| Breast crawl |
| Stroke | Frequency | Angle |
|
Front crawl |
_____ | |
| Back crawl | ||
| Breast crawl |
The pie chart shows the colours of sweets in a packet. There are sweets in packet.
What is the size of the angle for green sweets?

The pie chart shows the colours of sweets in a packet. There are sweets in packet.
What fraction of sweets are yellow? Give your answer in simplest form.

The pie chart shows the colours of sweets in a packet. There are sweets in packet.
What is the modal colour of sweet?
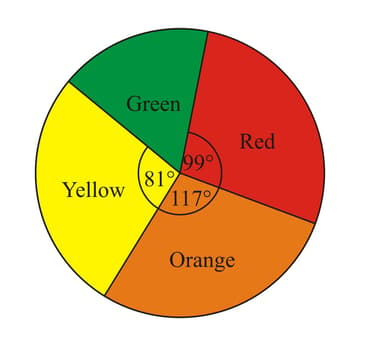
The pie chart shows the colours of sweets in a packet. There are sweets in packet.
How many red sweets are there in the packet?

The table shows what a farmer makes with the milk her farm produces.
| What is made | cheese | Butter | Cream |
| Percentage of milk |
Complete the table and then draw a pie chart to show the information.
| What is made | Angle made |
|
Cheese |
_____ |
| Butter | |
| Cream |