
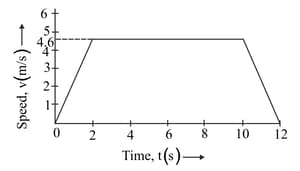
The speed - time graph of an ascending passenger lift is given alongside. What is the acceleration of the lift between second and tenth second?

Important Questions on Motion
The speed time graph of an ascending passenger lift is given alongside. What is acceleration of the lift during the last two seconds?
A car is moving on a straight road with uniform acceleration. The speed of car varies with time as follows:
| Time () | 0 | 2 | 4 | 6 | 8 | 10 |
| Speed () | 4 | 8 | 12 | 16 | 20 | 24 |
Draw the speed time graph choosing a convenient scale.
a. Calculate the acceleration of the car.
b. Calculate the distance travelled by the car in .
The graph given below shows how the speed of a car changes with time:

What is the initial speed of car?
The graph given below shows how the speed of a car changes with time.

What is the maximum speed attained by car?
The graph given below shows how the speed of a car changes with time:

Which part of graph shows zero acceleration?
The graph given below shows how the speed of a car changes with time.
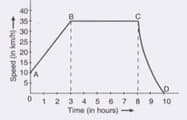
Which part of graph shows varying retardation?
The graph given below shows how the speed of a car changes with time.
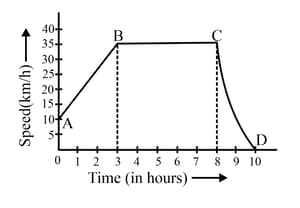
Find the distance travelled in first 8 hours.


