
The table given below shows the number of students from stream and for a college in the years to .
Year
In the year , the number of students in stream is how much percentage more than that of stream ?
Important Questions on Data Interpretation
Directions: The table below shows the cost of four cars in different towns.
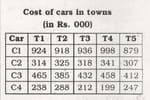
What is the difference (in Rs.) between the highest cost of and the lowest cost of
If the following relative frequency distribution table shows the distribution of in administrative service examination scores obtained by candidates
Then the original class frequency is:
Study the following table and answer the question.
Population of a locality from to
| Year | |||||
| Men | |||||
| Women | |||||
| Children | |||||
| Total | |||||
| Increase or decrease over preceding Year |
The number of children in is-
Refer the below data table and answer the following question
| Division/Std | Boys | Girls |
| Division A/Standard | ||
| Division B/Standard | ||
| Division C/Standard | ||
| Division A/Standard | ||
| Division B/Standard | ||
| Division C/Standard |
What is the ratio of boys to girls?
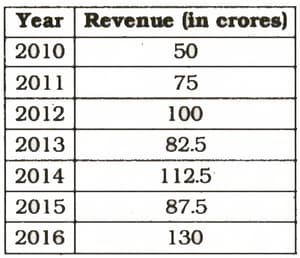
The table given below shows the revenue (in crores) of a company from years to
In how many year revenue was more than in year ?
Refer the following data table and answer the following question.
| Marks | Number of students |
| and above | |
| and above | |
| and above | |
| and above | |
| and above |
How many students have scored marks or more but less than ?
Refer the following data table and answer the following question.
| Year | GDP growth rate for the year (in ) |
If the GDP of the country was trillion at the end of , what was it at the beginning of ?
Refer the following data table and answer the following question.
| Subjects | Marks scored |
| English | |
| Hindi | |
| Maths | |
| Science | |
| Arts |
Five points are to be deducted from this student average of marks scored because of poor attendance. What will be this student’s net average score?


