
The table shows the number of different makes of car in a car park.
Complete the calculations below to work out the number of degrees for each sector of a pie chart to show the information given in the table.
Make of car
Frequency
Ford
Vauxhall
Toyota
Nissan
Draw a pie chart to show the information in the table. Label each sector and give the pie chart a title.
Important Questions on Interpreting Results
A group of people are asked which type of music they prefer. The table shows the results.
| Type of music | Frequency |
| Soul | |
| Classical | |
| Pop | |
| Other |
Draw a pie chart to show the information in the table.
A supermarket sells five types of milk made from plants. The pie chart shows the proportion of different plant milks the supermarket sold in one day.
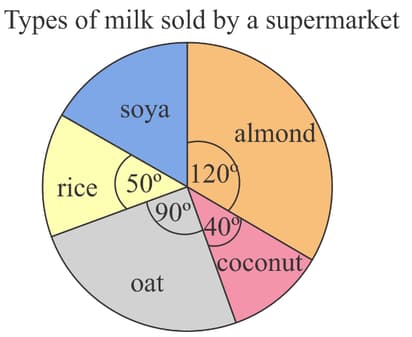
Which milk was the most popular?
A supermarket sells five types of milk made from plants. The pie chart shows the proportion of different plant milks the supermarket sold in one day.

What fraction of the different plant milk sold was almond?
A supermarket sells five types of milk made from plants. The pie chart shows the proportion of different plant milks the supermarket sold in one day.

What percentage of different plant milks sold was oat?
A supermarket sells five types of milk made from plants. The pie chart shows the proportion of different plant milks the supermarket sold in one day.

Altogether, the supermarket sold on this day. How many litres of soya milk was sold on this day?
The waffle diagram shows the colours of the cars in a school's staff car park.
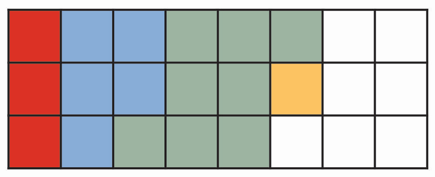
Use the waffle diagram to complete the following table.
| Colour of car | Number of cars |
| Red | |
| Blue | |
| Green | |
| Yellow | |
| White |
The waffle diagram shows the colours of the cars in a school's staff car park.
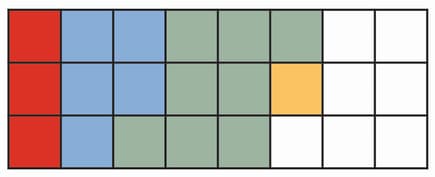
Draw a pie chart to show the information given in the waffle diagram.
The waffle diagram shows the number of hot drinks sold in a cafe on a day.
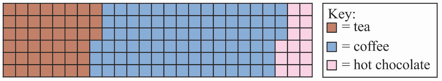
Use the diagram to complete the table.
| Hot drink | Number of drinks | Percentage of total | Number of degree |
| Tea | of | ||
| Coffee | |||
| Hot Chocolate | |||
| Total |


