
The table shows the results of an experiment to stretch an elastic card. Copy and complete the table, and draw a graph to represent this data.
Load/N
Length/mm
Extension/mm
Important Questions on Forces and Matter
The results of an experiment to stretch a spring are shown in table. Use the results ti plot an extension-load graph. On your graph, mark the limit of proportionality and state the value of the load at that point.
| Load/N | Length/m |
| 0.0 | 0.800 |
| 2.0 | 0.815 |
| 4.0 | 0.830 |
| 6.0 | 0.845 |
| 8.0 | 0.860 |
| 10.0 | 0.880 |
| 12.0 | 0.9.5 |
Name an instrument that is used to measure:
Atmospheric pressure.
Name an instrument that is used to measure:
Differences in pressure.
The diagram shows two closed tanks, A and B. Each tank contains gas and is fitted with a manometer to show how the pressure compares with atmospheric pressure outside the tank.
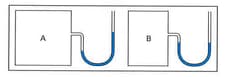
In which tank is the gas pressure greater than atmospheric pressure Explain how you can tell.
The diagram shows two closed tanks, A and B. Each tank contains gas and is fitted with a manometer to show how the pressure compares with atmospheric pressure outside the tank.

What can you say about the pressure of the gas in the other tank


