
The time, in minutes, taken by students to reply to their friends on social media is shown as a cumulative frequency curve.

Estimate the median time?(Answer withut units)
Important Questions on Representing Data: Statistics for Univariate Data
The time, in minutes, taken by students to reply to their friends on social media is shown as a cumulative frequency curve.
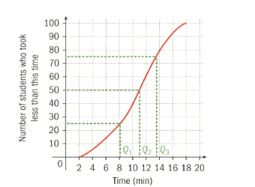
Estimate the interquartile range in time taken to reply.(Answer without units)
The time, in minutes, taken by students to reply to their friends on social media is shown as a cumulative frequency curve.
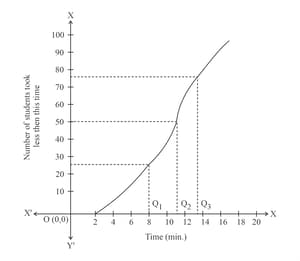
of the students replied in minutes or less. Find .(Answer without units)
The marks obtained by students are shown on this cumulative frequency curve. Mark the median point on the cumulative frequency curve?
The marks obtained by students are shown on this cumulative frequency curve. Estimate the upper quartile, lower quartile and interquartile range.
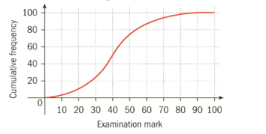
The marks obtained by students are shown on this cumulative frequency curve. Estimate the lowest mark needed to be in or above the percentile on the cumulative frequency curve.

A taxi company recorded the distance travelled by each of its drivers one Saturday evening.
| Distance | |
Construct a cumulative frequency table for this information.
A taxi company recorded the distance travelled by each of its drivers one Saturday evening.
| Distance | |
Draw a cumulative frequency diagram.
A taxi company recorded the distance travelled by each of its drivers one Saturday evening.
| Distance | |
Estimate the median, interquartile range in the distance travelled by the taxi drivers.(Answer median, interquartile values without units)


