
The two graphs in Figure show the characteristics of a metal wire at two different temperatures, .
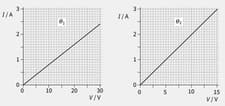
Calculate the resistance of the wire at each temperature.
Important Questions on Resistance and Resistivity
The two graphs in Figure show the characteristics of a metal wire at two different temperatures, .

State which is the higher temperature, .
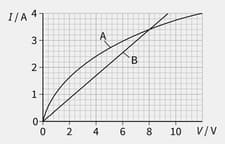
The graph in Figure 10.6 shows characteristics of two electrical components, a filament lamp and a length of steel wire.
Identify which curve relates to each component.

The graph in Figure shows characteristics of two electrical components, a filament lamp and a length of steel wire.
State the voltage at which both have the same resistance.

The graph in Figure shows characteristics of two electrical components, a filament lamp and a length of steel wire.
Determine the resistance at the voltage at which the resistance of the two components is same.
The graph in Figure was obtained by measuring the resistance of a particular thermistor as its temperature changed.
Determine its resistance at:
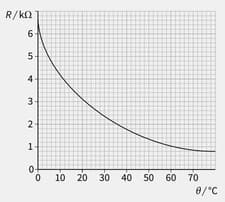
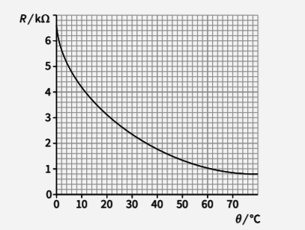
The graph in Figure was obtained by measuring the resistance R of a particular thermistor as its temperature e changed. Determine its resistance at: .

The graph in Figure was obtained by measuring the resistance R of a particular thermistor as its temperature e changed Determine the temperature when its resistance is: .

The graph in Figure was obtained by measuring the resistance R of a particular thermistor as its temperature e changed. Determine the temperature when its resistance is:.


